Preface
This book is about the principles behind the open government data movement and its development in the United States. The movement is framed as the application of Big Data to civics, where Big Data is not just the size of data but the ability for data to change the way we understand its subject. Topics include principles of open government data, the history of the movement, applications to transparency and civic engagement, a brief legal history, data quality, civic hacking, and paradoxes in transparency.
This book is organized into chapters covering the movement and its history, examples and a typology of open government data applications, a brief legal history of open government data, principles and recommendations for creating open government data, and limitations in the use of data for government transparency. The appendix includes excerpts of open data policy language and model language.
I should note several limitations of this book. First, it is from a distinctly United States perspective both in terms of the history of the movement and in the expectations for government data given by the principles in Chapter 5. Second, open government data is only a small part of the broader open government movement which encompasses classic open government (such as the Freedom of Information Act) as well as the newer fields of citizen participation and collaborative innovation. Finally, a disproportionate number of examples in this book are taken from projects related to transparency for the U.S. Congress. These limitations can all be explained by “write what you know.”
I would like to acknowledge Justin Grimes, John Wonderlich, Jim Harper, Carl Malamud, David Robinson, Harlan Yu, and Gunnar Hellekson for their contributions to my thinking about our field. In addition, I thank the Transparency Camp organizers, where much thought on this crystallized. And I thank my mom for her help editing.
* * *
This book can be read online at http://opengovdata.io. Some links are only in the online version. This is edition 1.1b — June 2012. Updates will be posted to the website.
Other useful resources about open government data and the civic hacking movement can be found at wiki.civiccommons.org and opendatahandbook.org.
* * *
Joshua Tauberer (@JoshData) is the creator of GovTrack.us, which launched in 2004 and spurred the national open government data community. He was also a co-founder of POPVOX.com, a platform for advocacy. He holds a Ph.D. from the University of Pennsylvania in linguistics and is also published in Open Government: Collaboration, Transparency, and Participation in Practice (2010, O’Reilly Media).
Contents
1. Big Data Meets Open Government
On March 20, 2008, lawyer, professor, and undisputed hero of technology geeks Lawrence Lessig made a career change. Well known for defending the freedom of speech before the Supreme Court against the expansion of copyright law, and for his books on the subject, on that day Lessig announced a new project. It was an organization named Change Congress with the goal to reduce the systematic, institutional, and of course unwanted influence money has on policymaking.
Influence, he might have said, starts with the campaign contribution check. Then it’s tickets to fund-raising events where one might rub shoulders with a future policymaker. There are corporate lobbyists who bring back large returns to their employers by “helping” lawmakers craft the law. And, lawmakers themselves may be keeping in mind a possible future career working for the very corporate interests they are regulating today.
This sort of corruption is “not the most important problem, it’s just the first problem . . . that we have to solve if we are going to solve other problems,” Lessig said at the launch of Change Congress at the National Press Club.1 Corruption gets in the way of good public policy, and if not that then at least public trust, he said. But it’s hard to market an idea that one admits is low down on the list of pressing issues before the country.
But what if the institutional character of government is the issue Americans actually find most important? Somewhere in history the idea that Americans care just as much about process as policy got rejected, and process fell out of favor as a legitimate policy question. Concern over whether states should elect representatives proportionally or by district plurality, how many seats Congress should have, whether Congress should have more or fewer committees — these issues are now considered marginal, inconsequential, and elite. It wasn’t always this way. Five amendments to the U.S. Constitution all having to do with government process were ratified between 1951 and 1971.2 The last major reorganization of Congressional procedure was enacted in 1970 (it addressed the power of committee chairs, among other issues), though it was covered in only 23 lines in The New York Times.3 Our Revolutionary War was started because of concern over process (summed up well in “no taxation without representation”) and resulted in a nation only after considerable debate over the form of the would-be government. Where policy was considered, the Constitution included only provisions that specified what government could not do, rather than what it should do. Contrast the U.S. Constitution with the 2010 Constitution of Kenya, which made policy as important as process in addressing such issues as slavery, health care, labor relations, and the environment. If process was the issue of the day in 1789, and still something debated as late as the 1960’s, it certainly is not today — and that should be a concern if you believe citizens actually do care deeply about process.
Yet a February 2012 Rasmussen poll of likely voters found “government ethics and corruption” to be edging out taxes, social security, and education, and well above two of the previous decade’s most popular issues, immigration and national security.4 Considering quid-pro-quo doesn’t have a tangible presence in the daily lives of people who are not professional politicians, we shouldn’t underestimate how important it is to us not to have our trust violated.
In Stealth Democracy (2002), John R. Hibbings and Elizabeth Theiss-Morse make the case that fairness is far more important to Americans than anyone has realized, and that it is trust in government rather than policy issues that underlies significant aspects of Americans’ civic behavior. In a survey they conducted, approval of government was strongly influenced both by whether the individual believed their government was enacting the right policy and also and almost as much by whether their government was conducting its business in the right way. It’s not surprising that process affects approval of government, but it is surprising that the relationship was strong, and stronger than, for instance, an individual’s personal economic situation.5 Perhaps even more importantly is the effect on civil unrest. Individuals who responded that they would disobey the law if they thought it was wrong were not those that actually thought the law was wrong, but rather were those who thought government process was wrong.6 In other words, Americans can believe in the rule of law even if they disagree with the law, but only to the extent they think the law was made in good faith.
That’s not to say that process has been standing still, and if there is a focus on any aspect of government process today it is on the public’s right to government information. By the time the World Wide Web was coming around the United States already had relatively strong freedom-of-information laws. The Freedom of Information Act had been passed several decades earlier. But digital technology is changing what freedom of information means because technology creates new applications for government information.
Digital access to government records began at the infancy of the Web. The Government Printing Office (GPO), which is the publisher of many of the government’s legal publications, went online in 1994 with the Congressional Record (one of Congress’s official journals), the text of bills before Congress, and the United States Code.7 The Republican Party, which was in the minority at the time, published its Contract with America that year with an emphasis on public accountability. Though the Contract did not mention the Internet, it was the new Republican House leadership the following year that created the website THOMAS.gov in January 1995, the first website to provide comprehensive information to the public about pending legislation before Congress. Later that year the Securities and Exchange Commission adopted a system originally created in the private sector to disseminate corporate filings to the public for free (more on that later). In early 1996 the Federal Election Commission (FEC) opened www.fec.gov, which was not only a website but also a repository of the raw data the FEC compiled. That data could then be analyzed independently by researchers and journalists.8 That year the Census Bureau made the Internet its “primary means of data dissemination.”9
Partisan politics may have driven some of this innovation, as in the case of THOMAS.gov, but information access was not confined to the Republican party. The 1994 “Circular A-130,” a memorandum from the Clinton Administration to executive branch agencies, might have been the earliest official policy statement asserting the public’s right to know through information technology that was itself made available on the Internet. It read, “Because the public disclosure of government information is essential to the operation of a democracy, the management of Federal information resources should protect the public’s right of access to government information.”10 Still, high level policies like those expressed in Circular A-130 don’t typically trickle down through federal agencies without some external pressure on the agency.
The opening up of the SEC’s EDGAR database, mentioned above, was one of those cases where external pressure was crucial. Since 1993, EDGAR has been a database of disclosure documents that various sorts of corporations are required to submit to the SEC on a regular basis. The disclosure documents have been intended to ensure investors and traders have the information they need to make informed decisions — making for a fluid trading market. However, in 1993 the “Electronic Data Gathering, Analysis and Retrieval System” was not available directly to traders. It was run under contract by a private sector company which in turn charged “$15 for each S.E.C. document, plus a connection charge of $39 an hour and a printing charge of about $1 a page.”11 But to Carl Malamud and others including Rep. Edward Markey, the price kept the information from many more traders who could not afford to access the information supposedly needed to make informed trades. (For comparison, at that time access to the Internet for an individual cost around $2 per hour.)
In a carefully executed series of moves Malamud was able to successfully incentivize the SEC to publish EDGAR to the public directly. With help from a grant from the National Science Foundation, contributions from other technologists, and New York University, Malamud bought access to the full EDGAR database and began making it available to the public, over the Internet with search capabilities, for free.12 Then after nearly two years of running the service and distributing 3.1 million documents to the public, Malamud fulfilled his stated plan to shut it down — but not without some fanfare. A New York Times article contrasted the SEC’s legal obligations with a stubbornly dry press statement:
The [Paperwork Reduction Act] says agencies with public records stored electronically have to provide “timely and equitable access” in an “efficient, effective and economical manner.”
“The law is real clear they’ve got to do it,” Mr. Malamud said.
But a spokesman for the commission, John Heine, said it was “too early to tell” whether it would take over Internet distribution of the Edgar documents. Mr. Malamud is asking “some of the same questions we’ve been asking ourselves,” Mr. Heine said.
. . .
“We’ve done two years of public service, thank you,” Mr. Malamud said, adding that he had personally financed a portion of the project.13
Four days later the SEC changed its position14 and worked with Malamud to adopt his service as their official method of public distribution over the Internet. Malamud’s technique was effective, and he has repeated the technique since: buy and publish government data, change public expectations, and then shame government into policy change.
The events of 1994–1996 laid the groundwork for major changes in the government transparency movement that would ocur some time later. But in the first ten years of the government going online, information technology was seen only as a tool for fast and inexpensive information dissemination. Data liberation, as it is called, is only the first part of open government data. What GPO began putting online in 1994 were the same documents it had been printing since 1861. That was absolutely the right place to start, and those documents are still crucial. Legal and scholarly citations today are largely by page and line number, so it is important to have electronic forms of printed documents that are true to the original’s linear, paginated form. But open government data can be so much more.
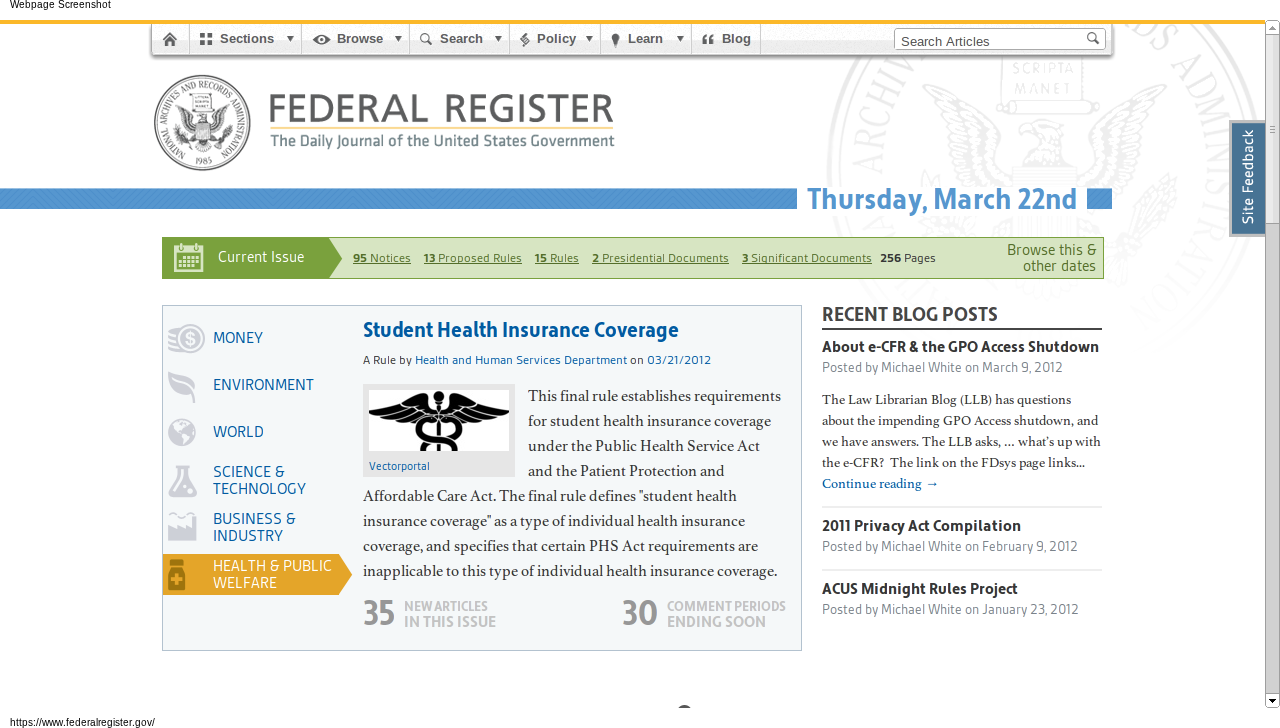
It wasn’t until 2009 that GPO recognized legal documents could be useful in other electronic forms as well. Information technology can make it easier to search, sort, share, discuss, and understand government publications — not just read them. Along side its publication in plain-text and PDF of the Federal Register (the executive branch’s publication of notices and new rules) GPO added a database of the Federal Register in XML format, a data format that makes it possible for innovators in the private sector to create new tools around the same information.15 The Archivist of the United States explained what happened next on his blog:
In August 2009, Andrew Carpenter, Bob Burbach, and Dave Augustine banded together outside of their work at WestEd Interactive in San Francisco to enter the [Sunlight Labs Apps for America 2] contest using data available on data.gov. Understanding the wealth of important information published every day in the Federal Register, they used the raw data to develop GovPulse.us, which won second place in the contest. In March 2010, the Office of the Federal Register approached the trio to repurpose, refine, and expand on the GovPulse.us application to bring the Federal Register to a wider audience. Federal Register 2.0 is the product of this innovative partnership and was developed using the principles of open government.16
The new Federal Register 2.0 (federalregister.gov, shown in Figure 1) makes the Federal Register publication vastly more accessible to anyone who is not an experienced government relations professional through new features including search, categorized browsing by topic and federal agency, improved readability, and clear information about related public comment periods. GovPulse wasn’t the only project to create an innovative tool based on the Federal Register XML release, though it has been the most successful. FedThread, created at Princeton University’s Center for Information Technology Policy, was a collaborative annotation tool. (It was discontinued in 2011.) And FederalRegisterWatch.com by Brett Killins provides customized email updates as search queries match new entries published in the Register.17
What happened with EDGAR and the Federal Register is happening with all of the most important government databases (both in the United States and abroad): actors in the private sector are stepping up to empower the public through not merely online access to government publications — we’ve had that since the ’90s — but through a digital transformation of government data into completely new tools.
* * *
Today’s thriving community of open government applications and developers was a decade away when Malamud was starting to define the open government data movement. And while 2009 was the year that government agencies began to widely participate in the open government data movement, we have to go back a few years to see how we got there.
From 1996 to 2004, while technology was rapidly advancing, entrepreneurship in open government continued. Cornell University’s Legal Information Institute, established already in 1992, expanded its website’s collection of primary legal documents to support research and make the law more accessible. The Center for Responsive Politics’s website OpenSecrets.org launched after the 1996 elections. OpenSecrets takes campaign contribution records published by the Federal Election Commission (and today other records as well), then significantly cleans up the data, analyzes it, and publishes it in a form that is accessible to journalists and the public at large to track money’s influence on elections. These are no doubt the longest running open government technology projects.
Entrepreneurship in government transparency was beginning in municipal and state governments around this time. Baltimore Mayor Martin O’Malley was facing one of the highest crime rates in the country, high taxes, and an under-performing government. He created CitiStat in 1999, an internal process of using metrics to create accountability within his government. The city’s information technology staff became a central part of the accountability system, and by 2003 CityStat’s information technology infrastructure was used to create a public facing website of city operational statistics.18 The CitiStat program and website were replicated in other state and local governments: Maryland’s StateStat launched in 200719, and New York City’s NYCStat launched in 200820 Although CitiStat, StateStat, and NYCStat focused on performance reports and metrics rather than raw underlying data, they proved through practice that data was valuable to keeping governments productive and accountable.
Putting a spin on this idea, the Washington, D.C. government chief technology officer Vivek Kundra created the D.C. Data Catalog at data.dc.gov in 2007, the purpose of which was to spur innovation by providing the public with raw data held by the D.C. government. (Kundra would soon be appointed as the federal chief information officer and would lead the creation of Data.gov.)
But for technologists in the private sector, the call to action came less from open government advocates or new government programs but rather from the infusion of “Web 2.0” and “mashups” in the grassroots digital campaigning of the 2004 presidential elections, especially in the Howard Dean campaign. Independent developers supporting the Dean campaign specialized the open source content management system Drupal for political campaigns, making CivicSpace (now CiviCRM). The campaign’s novel uses of the Internet and the CivicSpace project in particular were widely publicized. That sent a message, even if no one quite recognized it at the time, that developers have a role to play in the world of civics. It crystallized some vague notion of civic hacking (see Chapter 2 for a definition). By the next election bloggers were playing a serious role as part of the news media, and new yearly conferences including the Personal Democracy Forum began giving political technology legitimacy.
Michael Schudson, a professor in the Columbia Journalism School, wrote,
It is not only that the techies see themselves as part of a movement; it is that they see the technology they love as essentially and almost by nature democratic (but in this I think they are mistaken).21
It’s certainly true that we techies see technology as having a unique role to play.
Separately but around the same time as the rise of the Internet in politics, GPS navigation devices were starting to become popular. GPS is one of the earliest and yet most successful examples of government-as-a-platform, a concept recently promoted by Tim O’Reilly (the computer book publisher and also, in full disclosure, an investor in my company POPVOX). GPS is a signal sent by U.S. government satellites, but it had limited value until the end of the federal government’s intentional degradation of GPS signals for civilian use in 2000. Today, use of this digital government service is ubiquitous, and it is often combined with data from the Census Bureau on the nation’s roads and the U.S. Geological Survey’s satellite imagery and terrain data to create maps. Early applications in the modern open data movement were crime maps based on local police data (Adrian Holovaty’s chicagocrime.com in 2005 was one of the first Google Maps mashups) and tools to navigate public transportation. Public transportation remains a popular subject for developers.22
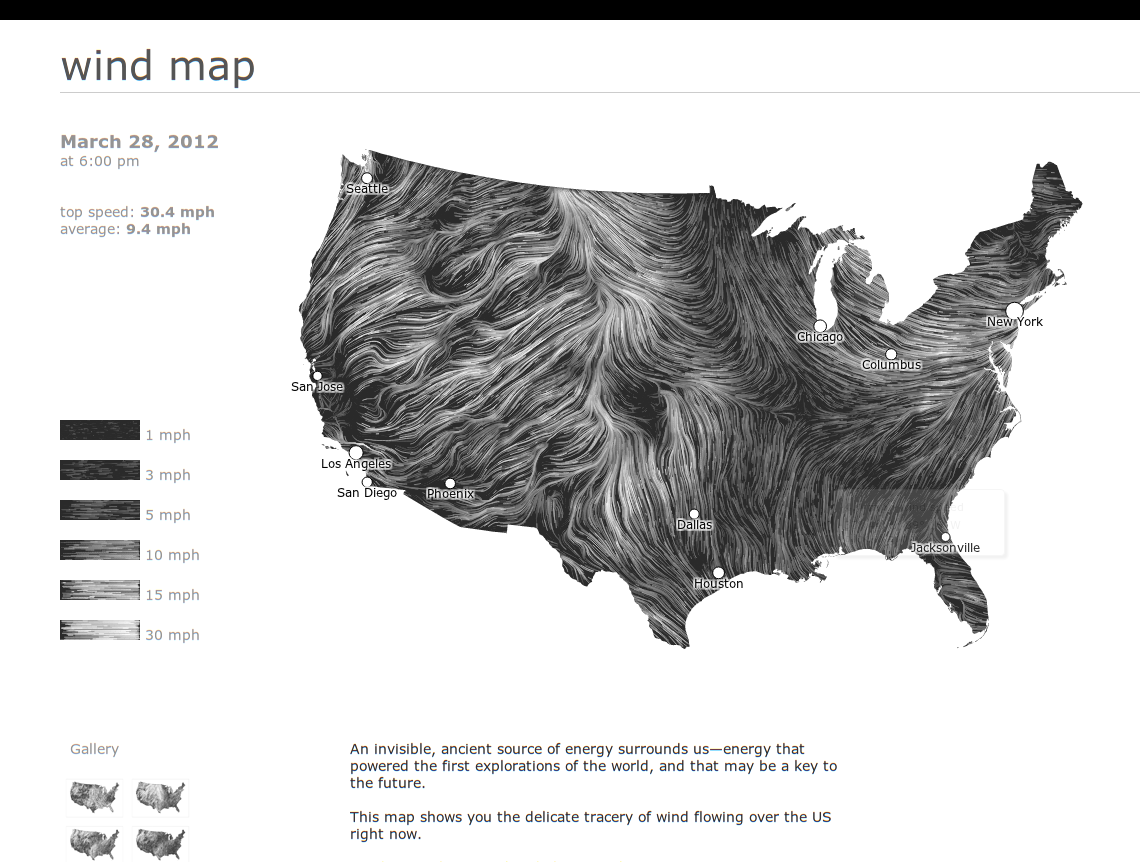
But building products on top of government data is not new, it is only more recognized now. For as long as there has been the modern weather report there has been business around government-produced information. The National Weather Service’s director of strategic planning and policy, Edward Johnson, told me in 2009, “We make an enormous amount of data available on a real time immediate basis that flows out into the U.S. economy.” Both their free-of-charge data and specialized high-reliability and high-bandwidth services (set up on a limited cost-recovery basis) are a crucial foundation for daily weather programming and weather warnings in newspapers and on television. (For a new use of weather data, see Figure 2.) So while much of the open government and open government data movements focus on using that openness to keep a close watch on our government, it is by no means the only use of government data.
Environmental, weather, and occupational safety data have obvious practical consequences for public health. Records of mine safety inspections came to focus in 2010 after the explosion in the Massey Energy mine in West Virginia, the largest coal-mining disaster in 40 years in the country. Because there was an active mine-safety beat reporter covering the area, it stands to reason that the disaster might have been averted had the safety inspection documents submitted by Massey to the Mine Safety and Health Administration been made thoroughly available to the public as they were produced.23
Local data helps neighborhood organizations make practical decisions (see section 3.3).
Government data contributes to the national economy, helps consumers be more informed, and makes our own government more efficient. By empowering citizens to perform their own market oversight, for instance, we reduce the need for regulations and the bureaucracy that regulations create.24 The business of government data is well established. The business world relies on XML corporate disclosures from the Securities and Exchange Commission that keep investors informed. The majority of Freedom of Information Act requests is in fact made for commercial purposes, such as competitive research.25 The private sector has long known the value of government-produced information, though treating government as a platform was only coined “Gov 2.0” recently.26
Information is a crucial driving force in innovation and is a unique kind of resource, a so-called “public good,” because consumption of information by one individual does not reduce the availability of information for others. This is why the benefit of information can extend far beyond its initial purpose. Governments as major producers of information are therefore in a strong position to spur innovation by promoting open government data.
As technologists in the early 2000’s were getting involved in politics and creating added value on top of digital government services, a much broader technological change was happening in other fields: the advent of Big Data. Dana Boyd and Kate Crawford (2011)27 described Big Data:
The era of Big Data has begun. Computer scientists, physicists, economists, mathematicians, political scientists, bio-informaticists, sociologists, and many others are clamoring for access to the massive quantities of information produced by and about people, things, and their interactions . . .
Big Data not only refers to very large data sets and the tools and procedures used to manipulate and analyze them, but also to a computational turn in thought and research (Burkholder 1992). Just as Ford changed the way we made cars — and then transformed work itself — Big Data has emerged a system of knowledge that is already changing the objects of knowledge, while also having the power to inform how we understand human networks and community . . .
It re-frames key questions about the constitution of knowledge, the processes of research, how we should engage with information, and the nature and the categorization of reality. Just as du Gay and Pryke note that ‘accounting tools...do not simply aid the measurement of economic activity, they shape the reality they measure’ (2002, pp. 12-13), so Big Data stakes out new terrains of objects, methods of knowing, and definitions of social life.
In other words, Big Data has two parts: 1) Big Data is data at scale, with millions of records and gigabytes of data, and 2) Big Data changes the way we think about the subject of the data in a significant way.
Open government data is the Big Data concept applied to open government. First, it is the application of government records at scale. Open government data applications make use of whole datasets to provide comprehensive coverage of information: not one SEC record but the whole database, not one agency’s rule-makings but the whole Federal Register, not the weather in your neighborhood but the whether anywhere in the country. A larger database with a wider range of information makes an application useful to a wider range of users, and it provides something for the long-tail of individuals with fringe interests who might not otherwise be served. There are thousands of bills being considered in Congress at any given time, and there is something for everyone — from agriculture to medicine and hundreds of issue areas in between. Data at scale also gives perspective. When a journalist reports that a certain Member of Congress has missed 10% of votes, is it a lot or a little? When plain-language advocates call for simplified language in laws, how can you know whether it makes sense without being able to survey a wide cross-section of law?
And then there is the second part of the definition of Big Data. Open government data differs from conventional open government policies in the same way that “data” differs from “information” or “knowledge.” The conventional open government movement relies on the disclosure of records, such as who is paying who, who is meeting with who, and records of government decisions and findings. The Freedom of Information Act (FOIA) and at the state level freedom of information laws (FOIL) are laws that grant the public access to these sorts of government records. Each FOIA/FOIL request is for a particular record. FOIA/FOIL create a direct relationship between the government and the information consumer.
Contrast this with the role of a journalist who distills wider-reaching knowledge for their information consumers, their readers. Journalists are mediators. Take the case of the 2002 winner of the Pulitzer Prize for Investigative Reporting. The 14-part series on the deaths of children neglected by D.C. social services was a transformation of thousands of government records into a new form more useful and informative for The Washington Post’s readers.28 The series could not have been told without access to government records at scale. And conversely, the value of those government records came from reporters’ skills in turning the records, and of course interviews, into something pointed, understandable, and actionable for their readers. Put another way, the knowledge that Post’s readers gained from the 14-part series could not have been FOIA’d from the government directly. The knowledge came from skilled synthesis by mediators who took raw data materials and produced an information product for consumers.
I think we tend to forget that mediators have always played a central role in the dissemination of information. Some of the most technologically savvy mediators today are the nonprofit advocacy organizations, who through email blasts keep their members informed of complex policy issues. The iconic mediators of the 20th century were the radio and television anchors. Before that was the penny press, one-cent newspapers starting in 1830’s New York that began the modern sort of advertising-fueled and politically neutral journalism, and going earlier the advocacy journalism leading up to the Revolutionary War.
Perhaps FOIA/FOIL never really served mediators well. Mediators need wide swaths of information that cross-cut individual events in time. The mediator analyzes the information for trends, distills the information into key points, and presents something useful to the information consumer that is very different from the source materials. And so it’s not surprising that since FOIA/FOIL provide access to such narrow windows into government decision-making that journalists would make up only around six percent of FOIA requests.29
Open government data is the type of disclosure suited for mediators, whether they be journalists, programmers, statisticians, or designers, who transform the originally disclosed bytes into something very different and of a greater value to a consumer. And so it is ironic that open government data faces resistance in government because open government data is not the future of e-government innovation: it is a new technological approach to the sort of information dissemination that has always existed. The best argument for open government data that I’ve heard is that this is how consumers already get their information, although they don’t see it in those terms. Whether you are a politician who wants to shape the debate or an administrator who wants to reduce the cost of processing FOIA requests, you have to show up to the party to have the chance to participate, and that party has always been the information mediators. As Derek Willis of The New York Times put it to me, it’s as simple as this: people go to Google to find information, so governments ought to make sure their information is findable on Google if anyone is going to see it. That means more than making sure your website is indexed. It means working with all of the “engines of information,” as Willis put it. The presumption of openness established by FOIA/FOIL is still important for open government, of course, but FOIA/FOIL stop short of guiding how government data can be disclosed in a way that promotes this sort of mediation.
The second part of the definition of Big Data is that the scale changes the way the subject of the data is understood, and that is true here. Open government data has changed the way the open government movement operates and the way individuals interface with government. It has broadened the set of professions that can participate in open government to any profession that can tell a story by transforming raw data into something new. And it has engaged more lay individuals in government transparency, and in government and civics more broadly, through the novel applications of government data that have been created by these professionals that make government more accessible and engaging.
In the rest of this chapter, which fills in the history of the open government data movement, and in the subsequent chapters, keep in mind the two fundamental qualities of open government data: scale and transformation.
* * *
I’ve never particularly liked politics. It’s all the antagonism that really gets to me, and the way political parties try to advance their position for the next election at the expense of public policy. I do like civics and legal theory, and that’s probably how I ended up in a class my freshman year at Princeton in 2001 called “The Speech is a Machine.”30 “[N]ow that software is simultaneously speech and a machine,” read the syllabus, “parts of the law that never clashed before now contradict each other.” Software code is speech in the sense that it is expressive. Code can be elegant and creative, both in the problem it solves and in the way it solves it, giving it potential protections under the First Amendment. And software is a machine in the more familiar sense, because software does something, bringing it under the regulations covering trade, patents, and actions.
The class was timely, right in the middle of the hay-day of music sharing over peer-to-peer networks. In class we staged a mock court case that hinged on whether the 1998 Digital Millennium Copyright Act (DMCA) could prevent playing DVDs you’ve just purchased — and out of class my professor Andrew Appel and his colleague Ed Felten were being threatened by the music recording industry over publishing their research on digital watermarks, a technology in development at the time to thwart unauthorized copying of digital files. And though the recording industry didn’t say it outright, everyone knew that the threat was backed by the plausible claim that publishing the research was made illegal by the DMCA (even though the recording industry had invited the researchers to conduct the study in the first place!).31 Peer-to-peer networks like Napster began getting shut down several months later by litigation from the recording industry — the recording industry thought the software crossed over the speech-machine divide. In response, students on college campuses began building their own small sharing networks with surprisingly advanced infrastructure (such as scanning publicly shared folders) — and then the first suits against college students came for running sharing networks. One suit was against a Princeton sophomore in 2003. It felt harsh, and personal, and it motivated many of us to consider how our technology expertise could be used in the public sphere.
The class was the first time that I saw that lawmaking was a dynamic process with interests competing for the best policy for themselves. It seemed to me that in the case of the DMCA, Members of Congress had either failed to understand the DMCA or simply caved to the business interests that lobbied for protection for their antiquated industry. But why didn’t the American public hold Congress accountable for a patently wrong decision? From class I was familiar with the website THOMAS.gov, the legislative resource created after the Contract with America. THOMAS is a comprehensive public record, but the details make it daunting to navigate for anyone but legislative professionals.
Looking back, I can think of three other services that I knew of that inspired me to dig into government’s Big Data. First was the Center for Responsive Politics’s campaign finance website OpenSecrets.org, which I learned of from working on the student newspaper. Second, in the late 1990s I had subscribed to email updates for the votes of my Members of Congress through a free service of America Online and Capitol Advantage (now a part of CQ Roll Call). So I knew that there were other useful ways besides THOMAS to present the truly vast amount of information processed by Congress and to help the public track the bills that interested them. While I thought of both OpenSecrets and the votes service as a part of Web 1.0, the third service I could relate to on a more personal level: it was an open source project out of MIT’s Media Lab. The project aimed to track the potential conflicts of interest of Members of Congress, and it was at the same time a parody of a project at DARPA, the research agency of the Department of Defense, that would mine large databases of information about the public for terror threats. DARPA’s project was ominously named Total Information Awareness, MIT’s project Government Information Awareness.32 The question in my mind, as in the minds of the MIT developers, was with better tools could the public hold Congress accountable?
At the same time I felt insulted by the government. The Library of Congress, which runs THOMAS, obviously had a database of all of the public information that went into powering THOMAS. But the Library did not make the database, in raw form, available to the public to innovate with. The difference is like being given refrigerator poetry magnets that have been glued into a pre-written sonnet. You can appreciate the sonnet, sure, but the glue has limited the obvious potential that comes from being able to rearrange the pieces and discover new meaning. Data is the same way. THOMAS (the sonnet) continues to be a vital resource for the American public even largely unchanged 15 years after it was created, but there is potential locked away when the information behind THOMAS (the poetry pieces) cannot be re-purposed or transformed into other applications.
By withholding their database from the public, Congress and the Library of Congress seemed to be saying they should be the sole source of information on what Congress was doing. That’s not only unfortunate, it is un-American. (I’ve been asking the Library to share its data since 2001, more than 10 years ago now. In fact, in 2009 an Act of Congress — or a small part of an act that I worked on with Rep. Mike Honda’s office33 — encouraged the Library to move forward with this. After that stalled, Rep. Bill Foster introduced a bill just on this point in 2010. Still no progress. The real hold-up is that the Library’s law division does not see publishing data as a part of its mandate authorized by Congress, and getting both the House and the Senate to agree on updating the Library’s mandate is slow going. In response to the open government data movement, the current House Republican leadership promised to make available the House Clerk’s legislative database, and some progress on that has been made with the launch of docs.house.gov in January 2012.)
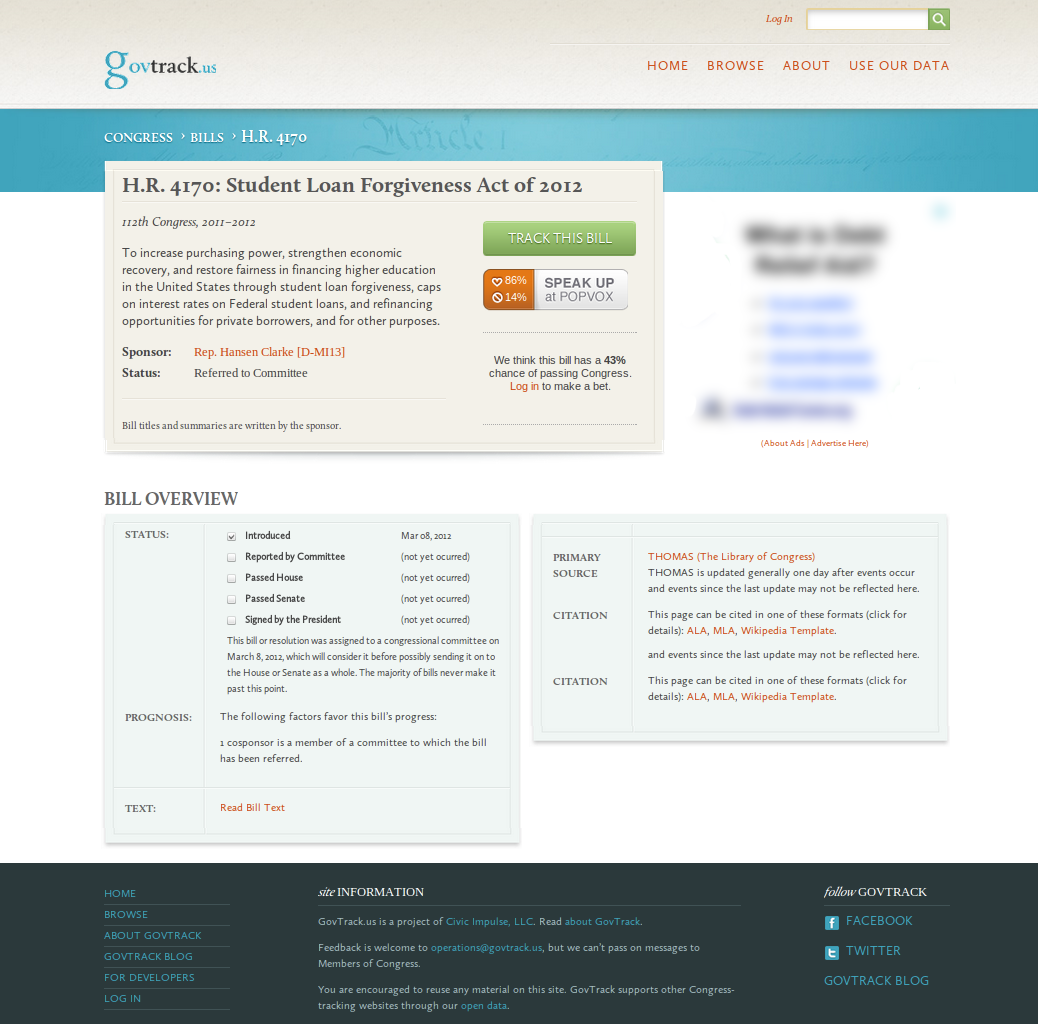
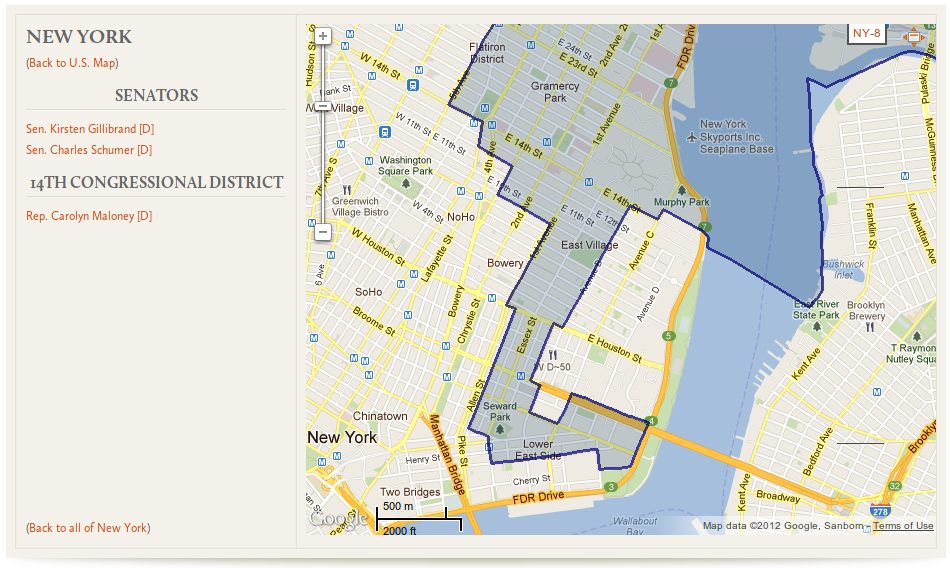
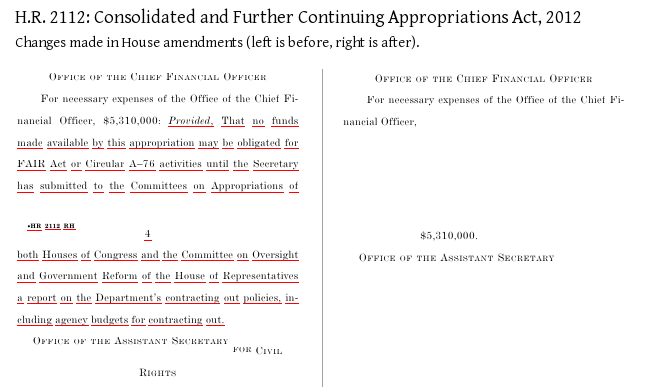
It was several years later in 2004 that I finally finished and launched GovTrack.us, a website that tracks the activities of the U.S. Congress (Figure 4). It was one of the first websites world-wide to offer comprehensive parliamentary tracking for free and with the intention to be used by everyday citizens. Most of the information on the site can be found elsewhere, but in so many different places and in formats that they are hardly useful to the American public. For instance, voting records are found for the House of Representatives on the House’s website and for the Senate on the Senate’s website. The status of legislation is listed on THOMAS, but schedules of hearings to discuss the legislation are scattered around several dozen Congressional committee websites. With many small programs GovTrack “screen-scrapes” all of these websites, normalizes the information, and creates a large database of Congressional information. The legislative database is the first part of GovTrack. With the data assembled, i.e. the refrigerator poetry pieces unglued, I was able to create what you see when you visit GovTrack.us: the status of legislation, RSS feeds for the activities of Congress, interactive maps of Congressional districts, and change-tracking for the text of bills. The website is ad-supported.34
Being able to read the bill that Congress is about to pass is a little like the experience of being in the capital for the first time and seeing the Declaration of Independence under glass at the National Archives. Our nation isn’t abstract. There it is on my screen right there. Or, there it is in my inbox. GovTrack is able to offer a unique view into Congress, giving the public a deeper understanding of how our government works and getting citizens more engaged. So I like to think that when a bill number — like H.R. 3200 — is said on the air of a late night TV show, such as The Daily Show (Figure 5) or Late Night with Jimmy Fallon35, that I might have contributed to the greater public consciousness of the legislative process. And at this point, civic education, rather than accountability, is GovTrack’s primary goal.
* * *
Toward the end of 2005 I got an email from Micah Sifry who the year before started the Personal Democracy Forum, a conference at the intersection of technology and politics. He wrote, “I’m doing some consulting for a new organization that is seeking to open up the system to more scrutiny, and it would be great if we could do this in a way that maximizes the network effects.” I didn’t know what “network effects” meant or what he was getting at at the time, but this was the beginning of today’s dominant organization in government transparency advocacy: the Sunlight Foundation. Ellen Miller, who had run the Center for Responsive Politics, had met Mike Klein, a lawyer and entrepreneur who discovered the value of commercial real estate data, and the two formed this new organization that would combine technology, policy, investigative reporting, and organizing. Sifry’s vision of leveraging “network effects” came to fruition in many ways, including the annual Transparency Camp conference started by Sunlight’s labs director, Clay Johnson. (Clay got his start in political technology by working as the lead programmer for the Howard Dean Campaign, bringing that part of this story full circle.)
Sunlight was primarily a grant-making institution at first. But a small project that began in 2006 changed that. That year was a mid-term election year in which a series of scandals involving Republican congressman threw the majority to the Democrats. Rep. Nancy Pelosi, who on election night became the presumptive next Speaker of the House, announced that the next two years would be “the most honest, most open, and most ethical Congress in history.”36 It was in this climate of cleaning house and standing up to corruption that John Wonderlich, then a telemarketing manager in Pittsburgh, posted a note on DailyKos (a left-leaning blog) recruiting help for a citizen journalism project. The goal of this project, the Congressional Committees Project, was to assign one person, a regular citizen, to each committee and subcommittee in Congress. That person would follow the committee closely and report back what the committee was doing to the group in a non-partisan way. The project was all set to begin, just waiting for Congress to come back from winter recess, when the “new media”37 staffer for Pelosi contacted Wonderlich and asked to have the group collect some feedback about how Congress could be more transparent in the coming years by making better use of technology. The request from Pelosi’s office ended the committees project as the telemarketer from Pittsburgh shifted his attention to leading what became the Open House Project, a formal response to Pelosi’s request.
The Open House Project, sponsored by the Sunlight Foundation, issued a report on May 8, 2007 at a press conference held in the basement of the U.S. Capitol building and in front of C-SPAN cameras. After many months of deliberation among a wide group of open government advocates, Wonderlich, Miller, myself, and several others presented the report recommending technology-related improvements to congressional transparency in the areas of legislative data, committee transparency, preservation of information, relaxing antiquated franking restrictions that kept congressmen off of social networks, ensuring the Congressional Record reflected accurate information, access to the press galleries, improving disclosure reporting, access to Congressional video, coordinating web standards, and sharing with the public the reports of Congress’s research arm, the Congressional Research Service.
One of the project’s first successes was how its recommendations on franking, written by David All and Paul Blumenthal, influenced the outcome of the 2008 House and Senate rules changes that allowed Members to connect with their constituents through social media38. It is hard to remember it, but for many years Congress’s internal rules actually forbade Members of Congress from participating in social networks like Facebook, stifling new ways Members of Congress and their constituents could stay in touch. And it wasn’t even clear to transparency advocates that they even should, since participation in one network might constitute an endorsement of a particular business. Endorsements then and now are rightly forbidden by congressional rules. But times quickly changed, congressional rules changed, and as it turned out, social media in government became much more of a public relations tool rather than a way to have a genuine dialog with the public.
Most of the remaining recommendations sadly still remain on the movement’s wish list, but the project was crucially important because it became a cornerstone of the policy work of the Sunlight Foundation. Wonderlich is now Sunlight’s policy director and is a registered lobbyist.
Following the Open House Project in 2007 Carl Malamud — who had liberated the SEC data in the ’90s — lead a workshop that wrote the “8 Principles of Open Government Data.” The 8 Principles gave us consensus on general principles that guide how governments should release data to the public, including that the data should be timely, in a machine processable format, and not restricted by license agreements (for the full principles see Chapter 5). That workshop not only crystallized ideas but also started to form a somewhat cohesive movement of individuals interested in government and data, picking up where the Open House Project left off.
Then came 2009, the year of the first two Transparency Camp conferences and Clay Johnson’s announcement that we had become a movement. It was also the year that open government data started to make visible strides actually inside government. I mentioned the improvements to the Federal Register already. A bulk data download from the GPO of the Code of Federal Regulations followed shortly after the Federal Register. We also saw the Senate start publishing votes in XML format, again a change that allows the private sector to create new applications around the data. (They followed six years behind the House. The two chambers of Congress operate entirely separately so the two chambers of course use completely different schema and IDs for Members of Congress, and I don’t know of any plan to unify them.) And the House began publishing its spending data electronically (more on that in section 5.2).
Since the House has published bulk data for the United States Code for some time, which Cornell’s Legal Information Institute has used to create the de facto online source to read the U.S. Code, a substantial part of federal law is available online and in a form useful to build new applications on. The judiciary branch of government is the remaining sore thumb in creating open access to federal law. More on that in section 3.2.
Data.gov, the IT spending dashboard, and the Open Government Directive39 which called for innovation in transparency, participation, and collaboration, all were published in 2009. To my surprise, the Directive addressed nearly all of the 8 Principles of Open Government Data, and essentially added two of its own: being pro-active about data release and creating accountability by designating an official responsible for data quality.40 But the White House projects of 2009 were about more than just transparency theory. Vivek Kundra, the first U.S. chief information officer and the driving force behind Data.gov, claimed the IT spending dashboard saved taxpayers $3 billion and accelerated other programs by giving government administrators better access to performance measures of information technology projects.41
Despite the Directive’s call for change, these projects have been generally criticized on two fronts. First, the apparent success of Data.gov has largely ridden on the inclusion of data sets that had already been available to the public. My favorite data set included early on in Data.gov was Federal Aviation Administration flight on-time statistics, which has been released in some form since 200342. A fellow coder Josh Sulkin and I built FlyOnTime.us, which used historical flight on-time statistics and weather data from the National Weather Service to predict future delays, for instance to help fliers make better decisions about connecting flights. (FlightStats.com, a commercial website, and FlightCaster.com, a startup that raised nearly $1M, independently had similar ideas.)
The second line of criticism has been that whatever new and supposedly “high value” data that was released following the Directive was not very interesting for government transparency. The highest rated dataset on Data.gov now is “Active Mines and Mineral Plants in the US” from the U.S. Geological Survey. Environmental and weather data comprise a large part of the data catalog. These are certainly important data sets for their connection to public safety. If journalists get a deeper perspective on mine safety and if that saves lives, then it would be hard to name an even more important data set. But the datasets don’t fulfill the promise of transparency. For that, we’re looking for open access to administrative records, records that tell us how decisions were made and that help the public stay informed about agency activity. It’s really no surprise that Data.gov has excelled in the sort of data sets it has since the Environmental Protection Agency and especially the National Oceanic and Atmospheric Administration in the Department of Commerce, the original source of most weather reports, have been leading the public dissemination of raw government data since well before there was an open government data movement.
Alon Peled, a professor of political science and public administration, explained in a review of Data.gov why federal agencies may have resisted open data:
Open Data architects failed to consider that datasets are valuable assets which agencies labor hard to create, and use as bargaining chips in interagency trade, and are therefore reluctant to surrender these prized information assets for free.43
Peled’s point highlights the need for open government advocates to stay grounded in reality.
Still, the benefit of Data.gov may be less in the catalog itself and more in the standards it sets for federal agencies and the cultural change it symbolizes. Harlan Yu pointed to what he says is under-appreciated infrastructure:
There’s a Data.gov manual that formally documents and teaches this process. Each agency has a lead Data.gov point-of-contact, who’s responsible for identifying publishable datasets and for ensuring that when data is published, it meets information quality guidelines. Each dataset needs to be published with a well-defined set of common metadata fields, so that it can be organized and searched. Moreover, thanks to Data.gov, all the data is funneled through at least five stages of intermediate review—including national security and privacy reviews—before final approval and publication. That process isn’t quick, but it does help ensure that key goals are satisfied.44
Health & Human Services (HHS) stands out as one of the few federal departments that hadn’t had a prior commitment to open data that has strongly embraced the Directive, now having released to the public data sets including FDA drug labeling and recalls, Medicare and Medicaid aggregate statistics, and national health care spending estimates, among others. HHS has been actively promoting reuse of their data with an Apps Expo, contests, and code-a-thons.45
At the municipal level, strong open data initiatives have been under way in San Francisco, Chicago46, Boston, and New York City47.
Data.gov spurred a world-wide movement of data.gov. catalogues, some of them better than our own here. Data.gov.uk, for one, has innovated in the application of Semantic Web technology to establish connections between datasets from different agencies. There now are hundreds more Data.gov’s in states and municipalities in the United States and in countries throughout the world.48 The Open Government Partnership, launched in mid 2011, is a multi-government effort to advance parallel transparency reforms in participating countries, focusing on disclosure, citizen participation, integrity, and technology.49 (I would be remiss at this point not to mention TheyWorkForYou.com and the non-profit behind it, mySociety, which had by this point long been leading the technology-meets-civics cause across the pond. TheyWorkForYou is much like GovTrack for the U.K. parliament and was developed independently around the same time. More about them in section 3.4.)
The Directive also called for innovation in citizen participation and collaboration with government, yet another new area of the open government movement. Law professor Beth Simone Noveck led this aspect of the Directive during her time as the U.S. deputy chief technology officer for open government (2009–2011) — she had previously invented Peer to Patent, which connects the U.S. patent office with expert volunteers to make the patent review process more informed. The White House’s We The People website at whitehouse.gov/petitions, launched in September 2011, fulfills some of the promises of participation. The site facilitates petitions which the White House pledges to respond to once a threshold of signatures is reached, currently 25,000 in 30 days.
The U.K.’s prime minister office began a similar system called e-petitions in 2007. In the current version at epetitions.direct.gov.uk, it takes 100,000 signatures to bring up an issue in the House of Commons. On August 11, 2011, a petition to cut social security benefits from rioters reached the threshold and was referred to a House of Commons committee, but the parliament has been out of session recently and has not formally debated the e-petition yet.50 Other participatory projects are occurring throughout the world. The Palestinian Prime Minister used Facebook to collect nominations for his cabinet, and the New York City council empowered neighborhood assemblies to determine local infrastructure projects.51 To Noveck, the benefit of applying technology to participating and collaboration is in making government smarter, policy better, and citizens motivated.
But for all of these promises we should remember to treat technology as mere technology. Governance is a social problem, not a technological problem. Michael Schudson, the journalism professor, wrote about perspective on the role of technology:
There is reason to be suspicious of the notion of technological revolutions. The printing press did not usher in democracy — or, if it did, it took its good-natured time! ... Later, the telegraph was said to have been the center of a communications revolution. But at first the telegraph — that is, the electronic telegraph as we know it — was a relatively minor advance on the ‘optical telegraph,’ versions of which had existed for two thousand years. [I]t required the spirit of entrepreneurship at the new penny papers ... to take advantage of the telegraph for news transmission. ... One needs not only technologies for a revolution, but also people who can recognize their worth.52
We’re not going to see technology usher in some new form of direct government by the people. Nor would we necessarily want it. Technology doesn’t make direct democracy any more practical now than in ancient times. Think about how you would feel if after your long work week your civic homework was to read a 100-page bill proposed by a stranger three states over. Not fun. That’s exactly why we elect people to do that work for us. The survey in Stealth Democracy found that most people wanted a sort of indirect democracy, like what we actually have.53 So as Schudson wrote, there is something democratic about technology but it is no silver bullet. It takes persistence and creativity to put technology to work in our civic lives.
* * *
Movements are guided by principles. Our principles are that data is a public good, that value comes from transformation, that government is a platform, and that process is a legitimate policy question. Those are the sort of principles about how the world should be. There are also principles that help us understand how the world is now, and they tend to turn into buzz words: Big Data, Web 2.0, Gov 2.0, mediation, transformation, open, participation, and collaboration. Buzz words or not, these principles highlight differences we didn’t notice before so that we can better draw analogies, and from there make better decisions. Is your website’s goal to “democratize data” or to “shine light” on corruption? If it’s the former, you may learn from such and such past examples of democratizing data, but if it’s the latter you may want to follow in the paths of these other projects. And so the remaining chapters are made up of all sorts of new terminology — these are all of the principles of the open government data movement.
2. Civic Hacking By Example
1. The Hacker Communities
“Hacking” has come to mean two quite different things. One is breaking into a computer system. That is the popular meaning, but not the one relevant to open data. The other meaning is a source of pride among programmers and geeks at large, and it means perverting something’s original purpose to solve a problem. Rube Goldberg machines are hacks. The use of the lunar lander to bring the Apollo 13 crew home was a hack. The first computer games were hacks (computers were not meant for games). Open government applications are usually hacks because they are based on information that had been published by the government for reasons other than the problem the open government hacker is trying to solve.
Civic hacking is a creative, often technological approach to solving civic problems.54 These civic problems run the gamut from voter registration and public education to helping consumers evaluate financial advisors.55 Civic hackers can be programmers, designers, or anyone willing to get their hands dirty. Some civic hackers are employed by nonprofits, such as Code for America or OpenPlans. Others work for innovative for-profit companies, such as the geospacial software provider Azavea in Philadelphia. Others are civic hackers only by night.
Civic hackers often meet to work on problems collaboratively at “hackathons,” one- or two-day community-run events typically held around a particular theme. While solving real problems often takes years of deliberate effort, these short events strengthen the connections among local hackers and help orient them to the complexities of civic problems. That is especially true when subject matter experts, especially those in government, participate. At a hackathon I ran in Philadelphia in 2009, two analysts from the New Jersey State Police worked over the course of two days with five volunteer programmers to develop a visualization tool for gang activity tracked by the police department.56 On that same day, nearly 200 developers across the country were participating in the Sunlight Foundation’s call for a Great American Hackathon.57 On December 3, 2011 hackathons were held in some 30 cities world-wide for International Open Data Day.58 There have been many, many hackathons in between and since.
Obviously our little gang statistics website in 2009 did not solve the problem of gang violence. That was never the point. Everyone knew that follow-through after the event just to finish up the website would be difficult, and frankly unlikely. Not every weekend has to solve a problem.
And yet the hacker community is stronger and more effective because of it.
Civic hacking has been spurred by contests (typically called “challenges”) as well. The first, back in 2008, was Apps for Democracy in Washington, D.C. Apps for Democracy put up $20,000 in prizes for applications built using the city government’s newly opened data. iStrategyLabs, which worked with the DC government to create the contest, said that the contest entries — including one mobile app to submit GPS-tagged photos of potholes and other city problems to the city’s 311 service — would have cost the government $2 million to build, 40 times the amount of money the DC government actually spent on encouraging the apps to be created (including overhead).59 (The D.C. government chief technology officer, who led the city government’s side of the contest, was Vivek Kundra, who also created the D.C. Data Catalog the year before and became the federal chief information officer the year after.)
After the Obama Administration’s Open Government Directive, the Department of Health and Human Services (HHS) really stepped up to the call for engaging with entrepreneurs to turn government data into value for the public. HealthData.gov currently lists 249 data sets and tools from HHS. Healthcare IT News reported in early 2012 about two recent challenge winners:
The winning apps . . . were each awarded $20,000 by [HHS’s] Office for the National Coordinator for Health Information Technology (ONC). They are:
Ask Dory! Submitted by Chintan Patel, Sharib Khan, MD, and Aamir Hussain of Applied Informatics, LLC, the app helps patients find information about clinical trials for cancer and other diseases, integrating data from ClinicalTrials.gov and making use of an entropy-based, decision-tree algorithm. . . .
My Cancer Genome. Submitted by Mia Levy, MD, of the Vanderbilt University Medical Center, the app provides therapeutic options based on the individual patient’s tumor gene mutations, making use of the NCI’s physician data query clinical trial registry data set and information on genes being evaluated in therapeutic clinical trials. The app is in operation at MyCancerGenome.org.60
These ideas are extraordinary, and often unpredictable from the data they chose to use. HHS is now heading into its third Health Data Palooza in 2012, an annual conference centered on public-private partnerships that have created innovation in public health using data and technology. (Todd Park, HHS’s chief technology officer who launched these initiatives, became the federal chief technology officer in 2012.)
In the case of Apps for Democracy, iStrategyLabs called the $2 million of value created by the contest a 40x “return on investment.” Viewed in this way apps contests are bound to be considered failures. Even if $2 million of man-hours were put into contest entries, most entries don’t yield lasting, useful products. Like hackathons, contest entries don’t usually solve problems.
And yet, the hacking community — and the public at large — is better for it. Not all apps submitted to a contest have to work for the public to benefit, as long as one app leads to a better app a few years later, and maybe from that a whole company that goes on to provide services over the long haul. Unfortunately, I don’t know if this has already happened in health data. There have been too many contests and too many entries for me to have followed Health 2.0 closely so far, but I’ll find out for the next edition of this book! It has happened in other fields, at least. In Chapter 1 Federal Register 2.0 was discussed, a project that came out of the Sunlight Foundation contest Apps for America. We’re only a couple of years into contests. The creative juices are only just now really flowing.
If you are new to civic hacking and want to get involved, start by looking at the work of Code for America (codeforamerica.org). They provide fellowships for civic hackers to work within city governments to help the city work better with technology. Their new Brigade program (brigade.codeforamerica.org) will help you find a project to work on that will help the people of the city you live in. And be on the lookout for civic-themed hackathons in your area on Meetup.com.
2. Visualizing Metro Ridership
Ever since my move to Washington, D.C. I have been obsessed with the Metro system, our subway. In this section we’ll create a simple visualization of the growth of D.C. neighborhoods using historical ridership data at Metro rail stations. While open government data applications come in many forms, they often share a common set of methodological practices: acquiring the data, cleaning it up, transforming it into an app or infographic or some other presentation, and then sharing the progress with others. Acquiring data sounds easy. It’s often not. Each of these four steps can bring its own challenges, and we will walk through some of these challenges here.
If you are a would-be civic hacker, look out for some of the data processing tricks that follow. If you are a data publisher in government, look out for simple things you can do when you publish your data that can go a long way toward empowering the public to make better use of it.
The neighborhood that I live in, Columbia Heights, has undergone significant revitalization since its Metro station opened in 1999, and especially in the last several years. It has become one of the most economically and ethnically diverse areas of the city. I suspected, going into this example, that Metro ridership would reflect the growth of the community here. The problem I hope to solve is to answer questions about my neighborhood such as how it has changed, when has it changed, and whether the locations of new transit stations worked out well for the community.
Step 1: Get the Data
The first step in any application built around government data is to acquire the data. In this example acquiring the data is straightforward. The Washington Metropolitan Area Transit Authority (WMATA) makes a good amount of data on its services available to the public. It even has a live API that provides rail station and bus stop information including arrival time predictions (which others have used in mobile apps). For this project, however, we need historical data.
WMATA has recorded average weekday passenger boardings by Metro rail station yearly since 1977, the first full year of operation for the subway-surface rail lines. Twenty-four stations were operational that year. The last line to finish construction, the Green Line, started operation in 1991. Historical ridership information by station is made available by WMATA in a PDF. PDFs are great to read, but we’ll see that they are pretty bad for sharing data with civic hackers. The location of the PDF “Metrorail Passenger Surveys: Average Weekday Passenger Boardings” is given in the footnote at the end of this sentence.61
If you are following along at home, download the PDF. Look it over to get a sense of global patterns. Is Metro ridership increasing over time? The final row of the table has total Metro ridership across all stations. It’s easy to see ridership has increased about five times over the past 30 years. But if you wanted to use the information in a serious way, such as to make a simple line graph of total ridership, you would run into a problem for 2008. The PDF actually reads “######” as the total ridership for 2008. (See Figure 6.) Hash marks are what many spreadsheet applications write out when the actual number can’t fit within the size of the cell. WMATA had the number, but it got replaced with hash marks when their spreadsheet was printed as a PDF.
If you want to make that graph, you can of course sum up the individual station ridership values in the column above it. Type 86 numbers into a calculator. Not hard, but you risk making a mistake. Wouldn’t it be nice to have the table in a spreadsheet program such as Microsoft Excel! That would make finding the 2008 value a breeze. This is the sort of problem we’ll run into as we get into dissecting the table in more detail next.
The second data set for this project provides latitude-longitude coordinates of all of the rail and bus stops in the WMATA system, which will be useful to plot ridership numbers on a map. WMATA provides this information in Google Transit Feed Specification (GTFS) format, which is a standard created by Google that transit authorities use to supply scheduling information for Google Maps Directions. Download google_transit.zip as well and extract the file stops.txt.62 The data totals 86 MB uncompressed, although we’ll only need a small slice of it.
WMATA, like many transit authorities, requires you to click through a license agreement before accessing the data. The terms are mostly innocuous except one about attribution which reads, “LICENSEE must state in legible bold print on the same page where WMATA Transit Information appears and in close proximity thereto, ‘WMATA Transit information provided on this site is subject to change without notice. For the most current information, please click here.’ ” (To WMATA: You can consider the previous sentence the attribution that is required for the figures displayed later on.) Although attribution is often innocuous, that doesn’t excuse WMATA from violating a core principle of open government data. Governments should not apply licenses to government data (see Chapter 5).
Step 2: Scrub the Data
Government data is rarely in a form that will be useful to your application, if only because your idea is so new that no one thought to format the data for that need. Normalization is the process of adding structure. Even if your source data file is in CSV format (a spreadsheet), you’ll probably have to normalize something about it. Perhaps dollar amounts are entered in an unwieldy way, some with $-signs and some without (you’ll want to take them all out), parenthesis notation for negative numbers (you’ll want to turn these into simple minus signs), and so on. The goal is to get everything into a consistent format so when you get to the interesting programming stage (the “transformation”) you don’t have to worry about the details of the source data encoding as you are programing your application logic. That said, you’re lucky if that is the extent of your normalization work. Normalization often requires a combination of cheap automated tricks and some time consuming manual effort. That was the case here.
WMATA’s historical ridership table in a PDF is great for reading by people, but copying-and-pasting the text of the table from the PDF to a spreadsheet program won’t quite work. I tried it, and you can see the before-and-after result in Figure 7. Copying from PDFs is hit-or-miss. In this case, it’s a bit of a miss: the years, which were supposed to be column headers, are running row after row. Other rows are broken into two, and the names of transit stations that have spaces in their names (that is, they are multiple words) shifts over all of the ridership numbers into the wrong columns. It’s a mess. If a spreadsheet is going to be useful, we need the columns to line up!
At this point, one could clean up the spreadsheet by hand to get all of the numbers in the right place. In this example project, that’s reasonable. But that’s not always going to be possible. The U.S. House of Representatives publishes its expenses as a PDF that is 3,000+ pages long. Imagine copying and then cleaning up 3,000 pages of numbers. It would take a long time.
For the techies, here’s the more intimidating way to deal with problem PDFs. (Non-techies might want to skip the next few paragraphs.) The first thing I did with the PDF was convert it to plain text using a Linux command-line tool. It’s more or less what you’d get from copy-and-paste, but saved straight into a text file. (This is especially useful when you have more than a few pages to copy-and-paste, and the result can be cleaner anyway.) Here’s the command63:
pdftotext -layout historicalridership.pdf
The result is a text file (named historicalridership.txt) which looks conveniently like the PDF. That’s good, because next you’ll need to edit it. Here’s what we got in that file from the pdftotext program:
                        Nov          All Daily Passenger...
Station                 1977         1978         1979  ...

Dupont Circle                7,784       10,124       13...
Farragut North               7,950       12,531       12...
Metro Center                10,493       13,704       19...
First, the columns don’t really line up. Half-way through things get shifted over by a few characters. That means we’re not dealing with fixed-width records. Instead, we’ll have to treat the file as delimited by the only character that separates columns: spaces. That leads to the second problem: Spaces not only separate columns, they also are used within the names of multi-word stations. After running into this as a problem later, I came back and put quotes around the station names with spaces in them, knowing that LibreOffice Calc will ignore spaces that are within quotes. So then we have:
                        Nov          All Daily Passenger...
Station                 1977         1978         1979  ...

"Dupont Circle"                7,784       10,124       ...
"Farragut North"               7,950       12,531       ...
"Metro Center"                10,493       13,704       ...
After saving the file, I opened it up in LibreOffice Calc. (It’s handy at this point to give the file a .csv extension, otherwise LibreOffice prefers to open it as a word processing document, rather than as a spreadsheet.) It’s easier in LibreOffice Calc to finish off the normalization. LibreOffice Calc asks about how to open it: choose space as the delimiter, the quote as the text delimiter, and turn on “merge delimiters.”
Non-techies, glad to see you again, because you are not out of the woods yet. Even with the columns lining up, there is more clean-up to do in the spreadsheets: Use find-and-replace to delete all of the asterisks in the column headers (the asterisks referred to notes in the footer, but we want the years in the header to be plain numbers), delete the topmost header and bottom-most footer text so that all that’s left is the table header row (the years), the station names and ridership numbers, and the row of total system-wide ridership at the end — we’ll use that to check that the normalization was error-free.
We’re lucky that WMATA provided redundant information in the file. Redundant information is a great way to check that things are going right so far (the same concept is used in core Internet protocols to prevent data loss). The final row of the PDF is the total ridership by year — the sum of the ridership values by station. Since we can’t be too sure that LibreOffice Calc split up the columns correctly, a great double-check is comparing our own column sums with the totals from WMATA. Insert a row above the totals and make LibreOffice compute the sum of the numbers above for each year. (Enter “=SUM(B2:B87)” into the first cell and stretch it across the table to create totals for each column.) The numbers should match the totals already in the file just below it — and they do, until the column for 2008 which I noted earlier was filled with hash marks. It should be a relief to find an error in source data. Source data is never perfect, and if you haven’t found the problem it’ll bite you later. It’s always there. Anyway, since all of the other columns matched up, I assumed 2008 was okay, too. Delete the two summation rows (ours and theirs) as we don’t need redundant information anymore.
All this just to prepare the first data file for use, and we have two files to deal with. Think of all the time that WMATA could have saved us and everyone else trying to use these numbers if they had just given us their spreadsheet file. Had WMATA put in the few extra minutes ahead of time to give a link to their spreadsheet, it would have saved us half an hour (and multiply that by everyone else who did the same thing we did)! This is a great example of how data formats are not all equal. PDF is great for reading and printing, but it completely messes up tables. WMATA’s original file was probably a Microsoft Word or Excel file anyway — having either of those would have made our copy-paste job a breeze.
* * *
The second data file we’ll use has geographic coordinates of the transit stations. The final step of normalization involved some real manual labor to match stations in the historical data (our spreadsheet) to records in the GTFS data (in stops.txt). It was important to do this by hand because there were no consistent patterns in how stations were named across the two files. Some differences in names were:
|
Historical File
|
GTFS File
|
|
Gallery Place-Chinatown
|
Gallery Place Chinatown Metro
|
|
Station
|
|
Rhode Island Ave.
|
Rhode Island Metro Station
|
|
Brookland
|
Brookland-CUA Metro
|
|
McPherson Square
|
McPherson Sq Metro Station
|
|
Nat’l Airport (Regan)
|
National Airport Metro Station
|
It’s more than common for the naming of things to be different in different data sets. Here the differences included: punctuation (space versus hyphen), abbreviations (“Nat’l”, “SQ”), missing small words (“Ave.”), and added words (“METRO STATION”, “-CUA”). In fact, WMATA’s file misspells the name of the airport station! Trying to automate matching the names could get you fouled up: several dozen bus stops on Rhode Island Ave all look something like “NW RHODE ISLAND AV & NW 3RD ST,” and you wouldn’t want to pick up one of these to match against the Rhode Island Ave. rail stop mentioned in the historical data.
I looked through stops.txt for each of the 86 rows (transit stops) in the historical data and typed in the stop_id from stops.txt into a new column called gtfs_stop_id. This took about 20 minutes. (While I was there I also fixed some typos in the stop names that came from the PDF.)
Note that I didn’t copy-and-paste in the latitude and longitude, but instead copied the stop_id. I did this for two reasons. First, it would have been more work to type up two numbers per station instead of one. Second, copying over the ID leaves open the possibility of linking the two files together in other ways later on if new ideas come up. We’ll do the real combination in the next step. (WMATA could have included the GTFS stop_id in the ridership table as well. A few more minutes on their part would save the rest of us a lot of repeated effort.)
Build Something
The creative part of any open government application is the transformation. This is where you take the normalized data and make something new of it. Something new can be a website to browse the data, a novel visualization, a mobile app, a research report. For this example, I wanted to create two visualizations. The first will be a simple line chart showing the raw ridership numbers from year to year. That chart will show us time trends such as when stations opened, which stations are still growing in ridership, and which have leveled out. The second visualization will be a map of the change in ridership from 2009 to 2010. A map will let us see trends across Metro lines and neighborhoods.
I’m a programmer, rather than a designer, so visualizations are not my thing. Fortunately, there are some good web sites that can create simple visualizations from data you upload. For the line chart, I used Google Docs. With the spreadsheet already cleaned up, it’s easy to copy the information from the spreadsheet into a Google Docs spreadsheet. Google Docs has a chart command that generates a decent chart. Though it does some odd things, so for Figure 8 (top) I actually used Google Fusion Tables first, took a screenshot, and then edited the image by hand to make it more presentable. (Google Fusion Tables is a little harder to use and requires you to transpose the spreadsheet first, which I didn’t want to get into here.)
The chart helps us understand the data. First, we see the stations have been opening gradually since the initial two lines opened in 1977. As I suspected, the Columbia Heights metro station has been seeing continued growth in ridership since it opened. And it’s not due to a system-wide trend, since other stations including Dupont Circle, Huntington, and Anacostia have leveled off, and for the latter two leveled off in the initial years after they opened. We can also see that the ridership increase in the Gallery Place station that began in the late 1990’s is probably related to the opening of the northwest Green Line stations, which include Columbia Heights. Gallery Place is a transfer station between the Green and Red lines. The 12,386 passengers at Columbia Heights today accounts for three-fourths of the increase in ridership at Gallery Place since the year the Columbia Heights station opened (although this doesn’t include ridership at other new stations) — in other words, the Columbia Heights station probably was well placed and serves riders who weren’t served by a Metro station before.
* * *
The second visualization — a map — needs a more specialized visualization tool. OpenHeatMap.com turned out to be a fast way to get a map that could nicely display changes in ridership from year to year. It’s not as turn-key as Google Documents — this requires more preparation. OpenHeatMap lets you upload a spreadsheet but it wants the spreadsheet to contain three columns: latitude, longitude, and a numeric value that it will turn into the size of the marker at each point.
The visualization requires merging the historical data spreadsheet with the latitude and longitude in the stops.txt file. I wrote a 20-line Python script to do the work. I find it’s often better to program things than to do them by hand even if they seem like they will take the same amount of time, because a program’s errors are usually correctable faster than a mistake from manual work. The script reads in the two files and writes out a new spreadsheet (CSV file) with those three columns. For the value column, I chose to compute the following: log(ridership2010/ridership2009), in other words the logarithm of the ratio of 2010 ridership to 2009 ridership. Log-ratios are more handy than using plain ratios because they put percent-changes onto a scale that surrounds zero evenly. (For instance, a halving of ridership would be a ratio of .5 and doubling a ratio of 2, whereas on a log scale, with base 2, they are -1 and 1, respectively.) But a straight arithmetic difference would work well here, too (ridership2010-ridership2009). See Figure 8 (bottom). As with the line chart, I edited the image by hand after generating it. In this case I adjusted the colors, drew lines for the actual rail lines (otherwise just the markers would be there, which is a lot harder to interpret), and dropped in an icon for the Capitol from AOC.gov. It’s a perfectly fair thing to do to tweak the output you get — after all, the only point here is to make a good visualization.
Each visualization gives a different perspective. The map tells us uniquely about how the changes in ridership are distributed through the WMATA rail system. The smallest markers actually represent a decrease in ridership from 2009 to 2010 and those occur mostly on the Red Line, one of the two oldest lines. The largest growth is occurring throughout the Green Line (the primarily vertical north-south line). The two large green markers at top center are the Georgia Avenue-Petworth (above) and Columbia Heights (below) stations. That neighborhood is clearly still going through development, compared to most other areas of the DC metro area shown here, which have stable or decreasing ridership.
Distribute
Once you’ve found value in your data, please share it! Don’t make other folks go through the tiresome process of mirroring and normalizing the data if you’ve already done it. Don’t think it’s your responsibility to share? Just remember that you’re getting a big leg up by having your data handed to you — taxpayers probably payed a pretty penny to have that data collected and digitized in the first place. You can distribute your work by making your mirror and normalization code open source, posting a ZIP file of your normalized data files, and/or using rsync, github, Amazon EBS snapshots, or creating an API.
I’ve made my Google Docs spreadsheet public and the URL to access it is in the footnote at the end of this sentence.64 Feel free to copy the numbers from the spreadsheet to explore the data on your own!
3. Applications to Open Government
Open government data is a sort of civic capital, a raw material that can be transformed like a diamond in the rough into something far different and much more powerful. While the first chapter covered examples ranging from public safety to airline flight delays, this chapter dives deeper into the sorts of applications that engage citizens with their government or improve policymaking.
The applications in this chapter are divided into four groups:
-
Sunlight as a disinfectant. The first group of applications focuses on using access to government information to weed out corruption in government.
-
Democratizing primary legal materials. In this group applications focus on the direct benefit to the public of access to legal materials, such as access to the law itself.
-
Informing policy decisions. Some information, especially demographic data, helps us understand our own communities better.
-
Consumer products. Applications in this group are products that bring open government to a wide consumer (non-wonk) audience.
These are by no means the only sorts of applications of open government data. Others are described in Chapter 1. The focus of this chapter is applications that use open government data for the purposes of open government.
1. Sunlight as a Disinfectant
The origin of the phrase
One of the most commonly perceived problems in government is corruption. Although 2009 rankings in the Global Integrity Report put the United States near the top on measures of anti-corruption law, procurement, and the budget process,65 corruption remains one of the most popular problems-to-fix in the open government community here.
Transparency has a long history as a tool for government oversight. Today’s anti-corruption movement focuses around a few sentences by Supreme Court Justice Louis Brandeis (1916–1939), who wrote in Other People’s Money shortly before his time on the court:
Publicity is justly commended as a remedy for social and industrial diseases. Sunlight is said to be the best of disinfectants; electric light the most efficient policeman. And publicity has already played an important part in the struggle against the Money Trust.66
But Brandeis wasn’t talking about government corruption at all. In fact, considering today’s scrutiny of investment banks for their role in Greece’s looming default, curiously high IPO prices of technology companies, and the 2008 world-wide recession, it’s frightening that Brandeis was writing about these sorts of issues just about 100 years ago. The “Money Trust,” composed of investment bankers like J.P. Morgan, suppressed competition and liberty through the control of credit by being both the bank and the investor.
Brandeis criticized the investment bankers for making a profit by shifting the risk of investments to others: by hiding the names of the sources of securities and relying on the deposits in their banks for their own company’s investments. The investment bankers at the time used their deposits to invest in and obtain majority shareholder control over corporations, creating what Brandeis called interlocking directorates. By having majority control over the rail road, telegraph, and other corporations that were also their banking clients, the barons controlled who could invest in what. “Can full competition exist among anthracite coal railroads when the Morgan associates are potent in all of them?” Brandeis wrote. The way Brandeis explained it, it was as if the investment bankers had created their own small nation of corporations and took a tax (commission) each time money exchanged hands between any of the corporations under their control. The root of the problem, according to Brandeis, was simply a pervasiveness of conflicts of interest throughout large financial transactions.
The future Supreme Court Justice called on the Money Trust to be broken through legislation, addressing the problem from two directions. On the one hand, Brandeis proposed an out-right ban on interlocking control: “The nexus between all the large potentially competing corporations must be severed, if the Money Trust is to be broken.” But the other part of his proposal was to require greater dissemination of information regarding the risks of securities and the motives of investment bankers. In his famous line about sunlight, Brandeis was just warming up for the pages that followed on which he printed the details of suspect transactions and his proposal to require additional information to be printed in prospectuses. “[T]he disclosure must be real . . . To be effective, knowledge of the facts must be actually brought home to the investor, and this can best be done by requiring the facts to be stated in good, large type.”67
Brandeis’ writing was a part of a movement of change for regulation of financial services. Shortly after his book was published the Clayton Antitrust Act and Federal Reserve Act were passed in response to the centralization of financial power in just a few banks, and the 1933 Glass–Steagall Act prevented investment banks from taking deposits (though this was later undone by the Gramm–Leach–Bliley Act in 1999, which some believe was a direct precursor to the 2008 crash).
The parallels between Brandeis’ world in 1914 and the world today are striking, just replace “investor” with “voter” and “corporation” with “elected official.” Conflicts of interest in government are pervasive. Transparency helps the public make better decisions, and although Brandeis did not mention it, transparency can also be a disincentive for bad behavior that has not yet occurred. Although in Chapter 6 I argue that these aren’t necessary consequences of transparency, they are often true and underlie many successful government transparency projects.
Sunlight Foundation’s transparency applications and related work
Brandeis’ quote is the origin of the name of the Sunlight Foundation. As Brandeis spoke of the conflicts of interest in the Money Trust, the Sunlight Foundation draws attention to the conflicts of interest in government. For instance, using their InfluenceExplorer.com project, which draws on data collected by the Center for Responsive Politics, Sunlight Foundation reported in June 2011 that Rep. John Mica and Rep. Bill Shuster, who proposed a bill privatizing Amtrak, had conflicts of interest stemming from campaign contributions. “Four of [Shuster’s] top five top contributors have ties to the railroad industry and could benefit if Amtrak’s assets are privatized,” they wrote. Contributions from railroad industry-associated individuals beat out most other industries in contributions to Mica.68 Brandeis would be turning in his grave.
Sunlight’s Party Time website (politicalpartytime.org) documents the “political partying circuit”: the continuous stream of fund-raising events taking place in D.C. restaurants and clubs. Party Time does a remarkable job of showing the public conflicts of interest, the gross amount of time lawmakers spend raising money, and the way money yields access. The website does that by showing scans of event invitations, like the one shown in Figure 9. In this invitation to an event for Rep. Mike McIntyre, an individual who wishes to attend must contribute at least $250 to his campaign, and a Political Action Committee who wishes to have someone attend must contribute at least $1,000. For those who contribute more, special honors are given such as being a party “host,” which might translate into a few minutes with McIntyre or Rep. Steny Hoyer, the Democratic whip who the invitation boasts will be in attendance.
Did McIntyre even need any of that money? McIntyre seemed to have enough to get himself elected since he gave $206,889 or 16% of his 2009-2010 war chest to the national and local Democratic Party organizations, which used the money to help other Democrats get elected.69 It wasn’t enough to get him a committee chair position, however. See section 6.2. (I don’t mean to single out this particular event. It is nothing unusual.)
Launched in July 2008, Party Time began collecting fundraiser invitations from anonymous sources, scanning and entering them into a database, and making them publicly searchable and viewable. The site includes an API and a bulk data download revealing over 12,000 invitations in the database at the time of writing.
Since invitations typically have different honorary levels of “sponsorship” and different minimum amounts for individuals and Political Action Committees, all with different terminology, it is difficult to reliably summarize the contribution amounts for particular levels. But for a first approximation using the site’s bulk data download, the average minimum donation required of an individual attendee came out to about $700, and $1,375 for PACs. Those levels have remained relatively stable since 2006. This is one way to quantify the price of access, though it’s very rough. For comparison, the current legal maximum contribution an individual may give to a candidate in an election is $2,500, and PACs may give $5,000.
Party Time’s FAQ concisely explains its purpose as something of a mix of civic educator and oversight tool:
By shining sunlight on these parties, the Sunlight Foundation hopes to provide another way for citizens to see how policy is influenced by insiders . . . There’s nothing wrong, or demeaning or sleazy about [lobbying]. However, we do believe that to make informed decisions, citizens need access to full and rapid disclosure of how lobbyists ply their trade [and] Seeing who is trying to influence their representatives, and how, provides valuable information.70
Much in the same way that professional journalism embodies a we-report-you-decide ethos, compared to advocacy journalism, Sunlight Foundation applications often focus on just-the-facts without making a case that the facts support any particular position.
Elena’s Inbox (elenasinbox.com, created in 2010) and more recently Sarah’s Inbox (sarahsinbox.com, created in 2011, shown in Figure 10) put archived public emails of public figures into a searchable Gmail-lookalike interface. The former posted the emails of Supreme Court Justice nominee Elena Kagan from her time a decade earlier as White House counsel in the Clinton administration. The latter posted the emails of Sarah Palin from her time as Alaska governor. When Sarah’s Inbox was created, Palin was a possible Republican presidential nominee, and she had been a vice presidential candidate several years earlier, making her emails of interest to the public. Palin’s emails were released in 24,000 printed pages by the state of Alaska in June 2011 in response to a 2008 request from Mother Jones. Although the emails were initially requested in the investigation of ethics complaints against Palin aides, and hoped to be relevant for the 2008 elections, their value in 2011 was as vague as Palin herself had been about whether she would be running for president.71 The email dump didn’t reveal any new scandals, but it did provide useful insight into Alaskan politics, as in this exchange between Palin and her chief of staff about Alaska’s congressman:
From: Michael A Nizich
Subject: Don Young
Date: Sep 16, 2008
Congressman Don Young would like to have a word with you sometime today if possible. His office has called and would like for you to call when your schedule permits.
From: Gov. Sarah Palin
Subject: Re: Don Young
Date: Sep 16, 2008
Pls find out what it’s about. I don’t want to get chewed out by him yet again, I’m not up for that.72
The emails in the release were, like this one, mostly about scheduling. But what is interesting about these projects is the innovative approach to government transparency that is one part data and one part design, or user experience. The email data dumps (or, more precisely, paper dumps) posed a needle-in-a-haystack problem for investigative journalists. It was apt then for a user interface to the data to pay homage to Google, the king of search, by cloning the Gmail interface. But the design choice was more than homage. The application of a familiar paradigm, that of reading your email, made the scale of the data that much more manageable.73
The projects are also examples of the dirty work of transforming unstructured stacks of paper into a clean database. In a blog post entitled “How Not to Release Data,” Sunlight’s labs director Tom Lee explained how each step of the White House’s release process for Kagan’s emails caused problems with the data, making it considerably less useful for transparency: printing the emails on paper, scanning the printouts with OCR (optical character recognition) to recover the text, and then encoding the scans in PDF format. Handing over the original digital files would have allowed Lee to build a more accurate tool in less time. But as Lee has since noted74 there were reasonable reasons for why the White House went through so much trouble, namely their statutory requirement to redact certain information. It’s not that redaction couldn’t be done digitally, but in fact there just aren’t good tools to do it. The third lesson of Elena’s Inbox and Sarah’s Inbox is that there are often unexpected reasons, usually legal reasons, that explain odd government behavior when it comes to transparency.
In a 2008 Sunlight Foundation project called CapitolWords.org the text of speeches on the House and Senate floors were turned into word clouds (Figure 11 top). A word cloud is a visualization of the frequency of key terms in text through variation in the size, color, and position of the terms in the image. The largest, brightest, and typically most centrally positioned words are the most frequently occurring in the text, the other words shown smaller, dimmer, and more peripheral. The middle image in Figure 11 is based on Speaker Nancy Pelosi’s remarks on the expensive economic bail-out plan in 2008. The image was created in 2008 by C. J. Olesh and Jeremy P. Bushnell using text transcribed by The New York Times and Wordle, a tool where you can paste in text and it creates a word cloud.75
Word clouds are both computation and art. Olesh and Bushnell’s cloud rotates some words vertically, making it more visually interesting, thereby increasing its effectiveness as a visualization. The cloud is drawn in shades of green which is thematically appropriate to the topic of the speech (money), and intensity, size, position, and orientation relate the prominence of the words in the text. Whereas Wordle lays the words out compactly, the 2008 CapitolWords spreads the words out diffusely, with the most prominent words focused in the center. Mixing form and function the cloud included a bar graph and word counts, which is helpful when trying to precisely describe what the word cloud is showing.
The re-launched CapitolWords.org in December 2011 took congressional floor speeches to a new artistic level, making them into illustrated holiday cards (Figure 12). Of course no longer a word cloud, the holiday cards mash up what was learned from the word cloud data analysis with a fantastical illustration technique to make a novel and extremely compelling visualization of what Congress is talking about.
There are a number of methods for generating a word cloud. Jonathan Feinberg, the author of Wordle.com, explained his algorithm on Stack Overflow:
Count the words, throw away boring words, and sort by the count, descending. Keep the top N words for some N. Assign each word a font size proportional to its count. ... Each word ‘wants’ to be somewhere, such as ‘at some random x position in the vertical center”.
In decreasing order of frequency, do this for each word: place the word where it wants to be, while it intersects any of the previously placed words move it one step along an ever-increasing spiral. That’s it. The hard part is in doing the intersection-testing efficiently...76
I include Feinberg’s explanation here because it is interesting how turning art into a repeatable procedure is one of the tools in a data hacker’s toolbelt. Rarely is art repeatable — the CapitolWords holiday cards are each the work of an artist, for instance — but when it works it gives the rest of us non-artists a tool we did not have before. (Some other methods of constructing word clouds, with source code, are linked from the StackOverflow page linked in footnote 3.1.)
The details of how to construct the word cloud affect its meaning. In a word cloud depicted in the August 16, 2011 episode of The Colbert Report, the words indicated what contributors to the Colbert Super PAC thought the PAC should advocate. Colbert presented two word clouds, one where words were sized according to the number of times they were suggested and the one shown in Figure 11 (bottom) where words were sized according to the dollar amount contributed to the PAC by the individuals suggesting each word. Colbert’s two clouds showed markedly different ideas, namely the difference between what people want and what people are willing and able to pay for. Even when much of the artistic process is made repeatable, the data hacker must wear several hats to make the right choices for how to best represent the information locked away in the data.
Professional journalism versus advocacy journalism
Not all of Sunlight Foundation’s work is policy-agnostic, but most of the organization’s advocacy can be found in their reporting, lobbying, and community organizing arms rather than in their development shop called Sunlight Labs. Inside the Labs, projects such as ClearSpending (a data quality analysis of information on usaspending.gov), the Open States Project (a national database of pending state legislation), and Better Draw a District (which draws attention to gerrymandering; the name is a play on The Colbert Report’s “Better Know a District” series) are all, at least on the surface, transparency for transparency’s sake. Although each of these projects relates directly to important questions of government process and the ability of citizens and oversight bodies to identify conflicts of interest, the projects neither indict Members of Congress, lobbyists, or contractors on any particular wrong-doing nor advocate particular policy changes. Instead, the applications are often the infrastructure needed for researching and reporting on particular cases, used both by the media at large and by Sunlight’s own reporting and policy staff, who do call out individuals on particular cases of conflicts of interest (as I noted above) and do advocate for policy changes (such as greater funding for government operations that enable transparency and enhanced financial disclosures).
The work of Sunlight Labs is a lot like the work of professional journalism, as I began to say above. The professional journalist works in the public interest to uncover facts, present all sides, and above all else remain free of any bias. But the Labs has an edge over traditional journalists. The Labs’ projects are exclusively open source, and where possible they also promote open data. In the terms of reporting, that means that others can vet all of their sources and step through all of their reasoning. Open source and open data projects are inspectable, even reproducible. A journalist rarely makes available all of their sources, sometimes with good reason, but mostly because they have no place within their medium to practically do so. An article also excludes the journalists intermediate thinking and work — what information did the journalist find but choose to put aside? Open source applications like Sarah’s Inbox suffer none of these problems. Software can neither have a bias, although its creators certainly can, but the source code itself serves as a full disclosure of how any bias affected the code, since the code is there to be seen.
Professional journalism is not the only form of journalism. Advocacy journalism has fallen out of favor, probably because it has been confused with propaganda, but it still exists and remains an important part of government oversight. Dirty Energy Money (dirtyenergymoney.com) is one example of advocacy journalism based on government transparency. If successful lobbying is about who you know, then an analysis of the networks of relationships among government actors is an important tool for finding conflicts of interest. Dirty Energy Money, developed by Greg Michalec and Skye Bender-deMoll for Oil Change International, shows the relationships between coal and oil energy companies and Members of Congress through campaign contributions from employees of those companies to congressional campaigns (see Figure 13). The network visualization permits the user to relatively easily explore relationships, moving from contributor to senator and then to other contributors. In this project, unlike some others, indictment is clear. According to Oil Change International, energy companies are “pumping their dirty money into politics.” Dirty Energy Money’s position on their issue does not make their visualization any less informative than if it had been created by someone else.
2. Democratizing Legal Information
Not everything is about corruption. Many open government projects, including one of my own, are about creating access to primary legal documents. Two factors distinguish projects that democratize legal information from the sort discussed previously that aim to be a “disinfectant.” First, the projects in this section do not presume that anything in particular is wrong with government. No judgement is made. Second, the value of these projects to their users is more direct than the value of the projects discussed in the previous section — an idea I’ll return to later.
The legal materials that have received focus by U.S. projects include congressional bills (e.g. by my own GovTrack.us and WashingtonWatch.com by Jim Harper), state legislation (Richmond Sunlight by Waldo Jaquith, Knowledge As Power by Sarah Schacht, and the Open States Project of the Sunlight Foundation), administrative law (Federal Register 2.0), statutory law (Cornell University’s Legal Information Institute and Virginia Decoded by Waldo Jaquith), and case law (RECAP out of Princeton University, all among many others). What these projects all have in common is digging deeply into a particular aspect of law, generally making the text available in a way it was not before, and often providing additional tools to track changes to the law.
GovTrack.us, my first open government project (see Chapter 1), was the first non-subscription website that presented a unified account of what Congress was doing along with tools to track future legislative activity. The site includes voting records, biographical information on Members of Congress, the status and complete text of legislation, and other information collected from congressional sources. There is no official downloadable database of most of this information. There are websites that display all of the information, but few databases that programmers like myself can transform into new applications. In putting all of this information together, new possibilities emerge. Novel statistics about the performance of Members of Congress become possible once the data is available to run the number crunching.
For instance, GovTrack computes leadership and ideology scores for Members of Congress based on their patterns of sponsorship of bills — shown in Figure 14. Charts like these help visitors to put the information they see in context. In GovTrack’s leadership-ideology charts, leadership is shown on the vertical axis (higher means more a leader) and ideology is shown on the horizontal axis. In the figure, Sen. Harry Reid, the senate majority leader, is marked with a triangle. If you did not know he is the majority leader, his position at the top of the chart would give you an idea. The figure also highlights Sen. Susan Collins. Well known as a moderate Republican, Collins’s ideology score reflects just how moderate she is. She is more liberal than some Democrats.
The statistical analysis doesn’t look at the content of bills or the party affiliation or anything else about the Members of Congress it is analyzing, but it is able to infer underlying behavioral patterns some of which correspond to real-world concepts like left-right ideology. To compute the ideology scores, I form a matrix with columns representing the senators and rows also representing the senators. Then I put a 1 in each cell where the senator for the column cosponsored any bill by the senator for the row, and I put zeros everywhere else. Then I use a statistics package to perform a principle components analysis on the matrix, in this case a singular value decomposition, and what comes back happens to be ideology scores.77
The leadership scores are based on Google’s PageRank algorithm. Google’s algorithm for ranking pages is widely known: the more links you get the higher ranked your page, but links you get from highly ranked pages are even better. In Congress we can look at the network of who is cosponsoring whose bills similarly. When a representative cosponsors a bill, it is a vote of confidence not only for that bill but also a vote of confidence or loyalty for the bill’s sponsor. If we imagine Members of Congress each as a “web page” and each time a Member cosponsors another Member’s bill it is a link from one “web page” to that of the other, then the PageRank algorithm is going to reveal the ranking of the implicit loyalties directly from the public, official behavior of the Members of Congress. And it does.78
Statistics are one way to give context. Another is to use personal geography. By overlaying Census geographical data with Google Maps, GovTrack made it possible to reliably determine your congressional district by zooming to street level. That is crucial if you live either near a district boundary or in a metropolitan area. Address databases only have about a 95% accuracy, but maps are almost always right. See Figure 15. Another form of context is to show changes over time. The deletion of eight lines from a House appropriations bill is highlighted with automatic red-lining using a tool for bill text comparison that I developed for POPVOX — see Figure 16.
The best part of GovTrack is that the site runs itself. I’ve programmed the site to periodically go out to government websites and fetch the information they have on Congress. It scans for new bill status, votes, and other information in a completely automated way. This process is called screen scraping: programmatically loading up web pages, looking at their HTML source, and extracting information using simple pattern matching. It’s not interesting programming work, and screen scrapers are easily confused because of the multitude of ways in which unstructured information can be displayed. For instance, several years after finishing the bill status screen scraper I learned — because my scraper was crashing — that a bill can actually be sponsored by not just a person but by a committee itself, or can even not have a sponsor (which has been the case with debt-limit-raising bills because no one wants to take responsibility for it). I hadn’t anticipated these cases, and unanticipated cases cause problems, sometimes leading to incorrect information being shown on the site.
GovTrack reaches about half a million people each month directly, and well over a million if you count visitors to websites and mobile apps built by others on top of GovTrack’s legislative database. When I opened up the source data that powers GovTrack, a collection of mostly XML files, others started to see the potential for building other tools that shed light on government processes in new ways. The three biggest reusers of the data are OpenCongress.org by the Participatory Politics Foundation (PPF), MAPLight.org, which puts a new spin on the connections between money and politics (see section 6.2 for more thoughts on MAPLight), and the mobile apps and APIs created by the Sunlight Foundation. (Both OpenCongress and MAPLight have been funded by the Sunlight Foundation.) Another interesting use of GovTrack’s data is IBM ManyBills, which is a visualization tool named after their ManyEyes project but for congressional legislation. At least two dozen websites have popped up relying on GovTrack data all trying to give the public a new way to get a grasp of their government — I’m sure there are many I’m not even aware of.
Now, truth be told, I started working on GovTrack.us in the early 2000’s because I thought the sort of transparency GovTrack would create could empower voters to make better decisions. That’s typical disinfectant-speech. But ten years later, never have I heard of a case of information found on GovTrack — whether it be a voting record or the text of a bill — changing anyone’s mind about who they would vote for in an election. At the time I began building the site I hadn’t yet even voted in an election myself, and it was grossly naive to think that that could have been the case. The reason is simple. At least one person in any election is not the incumbent, and if the challenger did not serve in Congress then GovTrack has nothing to say about whether you should prefer that candidate or not. The incumbent’s legislative record doesn’t actually help much in that decision.
Today I view the goal as something more basic and along the lines of civic education. Through greater understanding, I hope to reduce cynicism and mistrust in the cases where it’s not really called for. Sometimes it’s called for. But not always. For instance, many bill titles end with “and for other purposes.” I have been asked many times how one could support a bill that is so vague that it does not even say what it will do, and are congressmen trying to pull one over on us by granting themselves indefinite authority for “other purposes”? The reality is that bills often address too many issues to include them all in a succinct title. So in the end, it is just a title. The full text of the bill, which everyone can read, always spells out the details and often in the most rigorous lawyer-speak. Without this understanding of how Congress works, it is easy to be cynical. But this cynicism does no good.
* * *
Carl Malamud has been leading an effort to fill in the gaps where primary legal materials are not (freely) available to the public at all. Some of the gaps are state codes. Much of the gap are judicial decisions and related court documents which make their way behind pay-walls run by private companies (Westlaw, LexisNexis), associations (the American Bar Association), and the courts themselves. Malamud, I don’t think, would fault private companies for selling value they add to public documents, but he does criticize the courts and academia for not living up to a higher standard:
Our law schools and our law libraries are not active in maintaining the corpus of primary legal materials. We’ve outsourced this important function, and as a consequence, America is not being well served . . . Today, law libraries risk becoming a 7-11, where one vendor comes in and fills up the donut case, another stocks the ATM, and your job is all about managing vendors and answering an occasional query from a customer.79
Malamud’s project, under the moniker Law.Gov (but the website is law.resource.org), points to many practical implications of broad access to the law: improved civic education in schools, deeper research in universities, innovation in the legal information market, savings to the government, reducing the cost for small business of maintaining legal compliance, and greater access to justice. Free public access to legal materials isn’t intended to necessarily replace the expensive subscription services for legal professionals, but instead to open up the legal materials to a new audience.
All of the benefits to the public in the last paragraph of access to the law are what I meant by the value of these projects being more direct. A website that aims to reform government has indirect value to the public. First the public has to use the information to elect better policymakers, then the policymakers hopefully make better policy, and decades later the public benefits from the new policy. In the case of Law.Gov, the benefit is direct and immediate. Reduced costs for small business is reduced costs now.
It was very disconcerting the first time I came to grips with the fact that the law is so hard to find. There are both theoretical and practical reasons for this. On the theoretical side, federal statutory law works in such a way that for most of the law there is no actual document produced which you could say is actually the definitive law. The law comes about piecemeal through actions of government. The law is the culmination of those actions, regardless of whether the culmination itself is written anywhere. For instance, let’s say a bill called the Puppies Are Cute Act reads, “Puppies are cute.” The bill is enacted. Then a second bill amends the law by reading, “Strike the first word of the previous law and insert in its place ‘Cats.’ ” Nowhere is the current law “Cats are cute” actually written, but that is the law. In a sense, statutory law is the hypothetical document that would result if you tried to put all of the enacted bills together.
When bills are enacted they are printed one after another into the Statutes at Large. The Statutes at Large define federal statutory law, but in order to know the current law taking into account additions, revisions, and repeals one would have to read it from the start (starting in 1789) and assemble one’s own account of the text of current law. Occasionally the U.S. House of Representative’s Office of the Law Revision Counsel will do this, to create the United States Code. However, the Law Revision Counsel has no authority to change the law. Thus, the U.S. Code is (in general) not the actual law. (It is called “prima facie evidence” of the law.) If the Law Revision Counsel made a mistake, that mistake would not be a part of the actual law — you are responsible for knowing the actual law, not the Law Revision Counsel’s best-guess at the law, again, even if that law is not written anywhere. (Congress occasionally uses a slight of hand to get everyone on the same page about what the law actually is. On these occasions Congress passes a bill that repeals various past laws and enacts, essentially in their place, parts of the U.S. Code deemed current and reliable enough to turn into law. These sections that have been re-enacted into law are called positive titles of the U.S. Code.) A similar situation exists for administrative law, which is the law created by executive-branch agencies through power delegated by the legislative branch. U.S. administrative law is created through publication of rules changes in the Federal Register. The compilation of those rules forms the Code of Federal Regulations.
Though these documents don’t capture the complete law, on a practical level they are at least accessible to the public at large. Some of these documents have been posted online (and free) since the mid-1990’s. But online doesn’t always mean it is useful. The most useful place to read the U.S. Code has been on the website of the Cornell University Legal Information Institute (LII), at http://www.law.cornell.edu, which since 1992 has run the most effective browse and search interface for the Code and other primary legal documents. One of LII’s innovations has been creating permalinks to particular paragraphs within the legal documents. Although the Government Printing Office began publishing the Federal Register and Code of Federal Regulations in XML in 2009, and the Law Revision Counsel currently publishes the United States Code in XHTML, errors in the application of the XML formats of those documents have slowed the LII’s progress in making use of those files to create a more richly functioning website80 (though they have been used to create the Federal Register applications discussed in Chapter 1).
The judicial branch has no such compilation. Case law can only be determined by reading and interpreting court-issued opinions. But while bills, the Statutes at Large, the Federal Register, the United States Code, and the Code of Federal Regulations have been available for free and online for a long time now, court opinions and the documents in the dockets surrounding those opinions are held in two tightly-guarded electronic systems. One is called PACER and is run by the Administrative Office of the United States Courts. The other is a collection of private-sector databases including Westlaw and LexisNexis. These create practical barriers to access. Everyone pays to access these databases (which makes a joke out of PACER’s full name, Public Access to Court Electronic Records). The courts subscribe to Westlaw to have access to their own opinions. Other government agencies subscribe to Westlaw and to PACER, shifting money around the government to access the government’s own record of the law. Lawyers in the private sector subscribe. But of course the general public is left out of the equation. It is a bit of a farce.
Since these documents are generally not subject to copyright or other legal restrictions on redistribution, giving access to the public is legal if only the documents could be obtained. After Aaron Swartz downloaded 19,856,160 pages from PACER through a free trial (saving himself $1.5 million), all free trials were quickly suspended.81 RECAP, a project out of the Princeton University Center for Information Technology Policy at recapthelaw.org, attempts to create a public repository of court documents by asking lawyers to contribute PACER documents they paid to access into the RECAP public repository. RECAP is a web-browser extension that automates the process of uploading PACER documents to RECAP, and it works not so much because of a technological breakthrough in uploading so much as in human interface design: creating a method that is easy for lawyers to use. (RECAP is PACER spelled backwards.)82
A lot can be done with technology to make the law more accessible. Waldo Jaquith described the goal as “display[ing] local laws and court decisions in a way that provides clarity and context” using “embedded definitions, cross-referencing links, helpful explanations, commenting, tagging, decent design, and humane typography.”83 Virginia Decoded (vacode.org) is the first state Jaquith has launched in his State Decoded project. Figure 17 shows the site’s pop-up definitions of terms, which are sourced from other parts of the code, suggested citation text, and other tools that help the reader to read and make use of the law. (Jaquith previously created RichmondSunlight, which is a legislative tracking tool for the Virginia state legislature, similar to GovTrack.)
3. Informing Policy Decisions
Another type of government data is data that informs policy decisions. This data may not have much immediate economic value, but it guides better government decision-making and once those decisions have been made provides a context for evaluating those decisions. Although the value is not immediate, it is easy to identify. It is difficult to predict which applications of government data will succeed or fail, but it is easy to list the most important policy questions of the day and to find the data relevant to those questions.
The most interesting uses often come from neighborhoods. The National Neighborhood Indicators Partnership (NNIP) has been fostering the growth and sharing of neighborhood data since 1995. The partnership is made up of educational institutions, foundations, and local governments. In 2005, an NNIP partner in Chattanooga, Tennessee, assembled data that highlighted shortcomings in elementary school reading proficiency. In response to the new information, the county mayor created a Chief Reading Officer position.84
In Baltimore, the locations of two new charter schools which opened in 2005 were determined in collaboration with the Baltimore Neighborhood Indicators Alliance at the University of Baltimore using public demographic data.85
In Cleveland, public data obtained by the NNIP guided welfare-to-work policy initiatives:
NNIP’s Cleveland partner mapped the residences of welfare recipients needing employment against the locations of new entry-level job openings in the metropolitan area. Doing so dramatized a serious spatial mismatch that caught the attention of policy makers. The existence of the data and tools (e.g., the ability to forecast changes in commute times that would result from alternative changes in transit routes and schedules) and the prominence the analysis was given in the press were credited as key motivators for a substantial state grant for welfare-to-work planning that brought child care planners as well as transit planners to the table for the first time on this issue.86
A persistent problem for Philadelphia has been its racial disparities. When I lived in Philadelphia during graduate school I saw first hand the geographic divisions created by the commercial corridor downtown and by the universities in West Philadelphia. Geographic isolation makes it easy to fail to see, or to ignore, other differences.
The Philadelphia Inquirer collected data on homicides since 1988 and shared it using Google Fusion Tables. Josef Fruehwald, a graduate school colleague of mine, created the graph shown in Figure 18. Here is what he observed:
Since 1988, the African American community has been living in a Philadelphia with approximately a murder every day, or every other day. The White community, on the other hand, has been living in a Philadelphia with a murder once a week.87
There are two reasons why I chose to include this example here. First, Fruehwald’s analysis has a different purpose from most crime-based visualizations that data geeks have made over the last few years. Crime maps, for instance, are often titillating because of the fears the user has of walking into the wrong neighborhood. Fruehwald’s analysis, and especially his characterization of what it means, is instead rather humbling for those of us that lived in Philadelphia without knowing how bad it was for some communities.
The second reason is more technical. Fruehwald’s choice of vertical axis, the murder rate, was carefully crafted to put the values into meaningful terms. It shows the average time between murders, in days, which is more understandable than the more typical measure of incidences per month or per year. This isn’t just a graph. It is a visualization made to covey a message.
4. Consumer Products
Open government has traditionally been about access to information. When you think about open government applications, the first to come to mind are those that expose otherwise hard to find government information. That was the case in both the disinfectant category of apps whose primary users are journalists and watchdogs and in the legal materials category of apps whose primary users are wonks and professionals. But there is a new category of consumer-focused open government applications. These applications aim to serve needs everyday people actually have while simultaneously facilitating better governance. It is a sort of government-as-a-platform approach to civic problems.
Tom Steinberg, who leads the U.K. nonprofit mySociety, summarized the idea behind this category best:
People have needs. Sometimes they need to eat, sometimes they need to sleep. And sometimes they need to send an urgent message to a local politician, or get a dangerous hanging branch cleared off of a road. What people never, ever do is wake up thinking, “Today I need to do something civic,” or, “Today I will explore some interesting data via an attractive visualisation.”88
FixMyTransport by mySociety lets U.K. public transportation riders report problems, such as litter, late buses, or ticket problems. And other visitors to the site can give you advice about the problem you are having. The application improves governance by helping the government address these issues faster and better. It does so without accusing the government of doing a bad job, and probably gets better results because of that. It is a consumer product because people want to vent when they have a problem, and this site lets people do that (in a constructive way).
SeeClickFix and Open311 are similar projects in the United States.
Many personal motivations can be guided into improving governance. Above, the motivation to vent about a problem was guided into improving public transit. Another successful example of this is the Peer to Patent program created by Beth Simone Noveck:
Like every government official faced with the task of making important decisions with too little time and access to too little information, patent examiners have only between 18-20 hours to read, research and write up the determination of which applications deserve to become a patent . . .
With the consent of the inventor and the USPTO, the Peer-to-Patent project posts a pending application online for three months during which time the volunteer public can read the application, discuss it with others, submit suggested avenues for research, submit prior art, and rate the submissions of others for relevance to the pending application.89
Peer to Patent is not really a consumer product. Its goal is to improve the patent process, and it has no apparently direct benefit for the expert volunteers that participate. So why do people participate? According to Noveck, a drive to perform public service is one factor. But there are other factors:
Yet others want to show off their expertise in the hope that they will get noticed and hired by the inventor, the USPTO or other participants. They participate in order to add it to their resume.90
Who would have thought that such self-interest could actually improve governance, right?
The problems addressed by disinfectant-oriented projects and consumer-oriented products can be similar. mySociety’s WriteToThem.com and POPVOX, a company I co-founded in 2010, help people contact their Members of Parliament or Members of Congress. Like traditional open government applications, these two websites also have something to do with government accountability. But the approaches are different from websites that indict government as broken and not listening.
At POPVOX, we found that constituent letters to Congress are often lost in an overloaded system. Congressional offices received more than 200 million emails in 200491, and extrapolated to today it is around 300 to 2,000 emails each day for each congressional office. Congressional offices only have a small staff to process the incoming letters. They tally the letters, select a limited few to share with the Member of Congress, and write bulk replies to constituents who wrote in on the same issue. Congressional staff readily admit that they don’t have the capacity to read each letter thoroughly. That’s unfortunate because Americans put in a lot of time writing these letters, trying to make convincing arguments, and advocacy organizations pay a substantial amount of money to P.R. firms and Internet services companies to get their supporters to write in to Congress.
This is a problem of scale. Everyone has an opinion, but there is no way for a single congressman to process 600,000 ideas (the approximate average size of Congress’s 541 congressional districts including territories) or for a single senator to process 37 million ideas (the population of California). Before email, the cost to the constituent to share his or her opinion was high. That acted as a natural filter, and there was a time, long ago, when mail volume was so low — because it was costly — that Members of Congress read their own mail. Today no such filter exists, and it would be a shame to impose an artificial cost to telling your Members of Congress what is important to you.
How do you solve this? In planning our road map at POPVOX we considered personas, caricatures of the different sorts of individuals that we had something to offer. We talked about Cynical Cindy who wants to keep Congress accountable, Aspirational Aaron who wants to run for office, and Issue Isabel who has a deep, personal connection to an issue and will put in the time to rally her cause. And because some of the most successful products tap into the deepest parts of our humanity, we even looked for what might be the embarrassing motivations that drive each persona, whether it be pride, greed, or the need to feel connected. Putting users first is the core of the “lean startup” philosophy. One of our advisors told us that a company’s value proposition is the intersection of the company’s goals with its users’ desires and needs. Successful products tap into those desires and needs.
POPVOX has been successful because it addresses a governance problem by being a consumer product. Like Peer to Patent, it crowd-sources expertise that helps government make good decisions by tapping into the personal motivations and interests of its users. And also we were smart about how we delivered letters, making sure that they were in a format most useful to the congressional staff handling them.
In our first year of operation POPVOX delivered hundreds of thousands of letters to Congress, many containing personal stories of how public policy affects real lives. Letters were on issues as diverse as health care, gun carrying rights, military pay, and the slaughter of horses. The letters were constructive and contained a wealth of information that may have influenced policymaking. And I was especially proud that even in this time of such low approval of Congress, the vast majority of letters written were actually in support of a bill, rather than in opposition. There are still ideas in Congress that the public can rally around.
4. A Brief Legal History of Open Government Data
Let’s say we could start from scratch. What would a technologically-enabled open government look like? Would it involve mandatory open records? Live streaming of all public meetings? Maybe the right to information would be a constitutional right — something that new constitutions in the world are beginning to adopt. The new constitution of Kenya which was ratified in the summer of 2010 reads:
(1) Every citizen has the right of access to information held by the State. (2) Every person has the right to the correction or deletion of untrue or misleading information that affects the person.92
Kenya is only the latest and not the first to make information a right. According to the website Right2Info.org93 the right to government-held information is protected by the constitutions of roughly 40 countries. The Philippines has a particularly strong provision specifically mentioning records, documents, papers, and research data. The United States is conspicuously not among these countries.
But while hypothesizing an ideal right to information may be a useful exercise, the history of the right to government-held information has at least as often as not been born out of the practical, immediate needs of those in power.
Three Origins of Open Access to Law
It’s impossible to say exactly when and where open government data began, but a useful starting place is in open access to law. Three examples of open access and codification — in Archaic Greece, Visigothic Europe, and the American colonies — paint an interesting picture of how access to the law arose through anything but a democratic ideal.
When Athens codified its law in the 6th century BC, moving away from an oral tradition, it was a small part of a larger set of reforms implemented by the archon Solon. During this time, the public at large was of course not very literate. They could not have made much use of codified law. But according to author Jason Hawke, there is another reason to believe that the law was first written down not with the ideas of a participatory government in mind, but instead with the needs of the elites: The laws that were codified were those that kept wealth in place. Hawke wrote,
Plutarch states that Solon enacted a law forbidding dowries in all marriages save those which occurred between an heiress and her kinsman, the bride otherwise bringing with her only three changes of dress and inexpensive household goods. . . . These statutes regarding the control of property exhibit a common concern: the preservation and stability of the patterns of resource-ownership. . . . [T]he overall effect of such legislation was to conserve the distribution of wealth and resources and to prevent the easy movement of property and the de-stabilization of social and political arrangements within the community as a result.94
Athens was undergoing significant socio-economic changes during Solon’s time. Codification appears to have been a part of a reactionary program of holding onto a social structure upended by population growth and new wealth. Democratizing or equal justice ideals were not a reason for the modernization of law that took place.
In colonial America, as in Archaic Greece, the codification of law emerged out of the needs of those in power. There, inexperience and a lack of information lead to gross economic confusion, and it was the need to end that confusion that lead to advances in government transparency. A Virginia critic wrote at the time that “the Body of their Laws is now become not only long and confus’d but it is a very hard Matter to know laws are in Force and what not.” As a result, “[t]owns were legislated into existence at inappropriate sites; . . . [and] the price of bread was assigned on sizes the bakers did not sell.” Codification arose out of frustration among legislators, as a means to attack other political offices, and perhaps also to rally their constituents.
The publicity probably began simply because legislators went home between sessions and found that their constituents had no copies of laws and no idea why the legislators were fighting the governors . . . [In 1710] the [Pennsylvania] assembly began publishing its acts and laws twice a week, partly so members could have up-to-date copies, partly so interested groups could appeal acts before the end of a session. Ten years after that, in 1720, the house began publishing its journals. In 1729 and 1740 it published codifications of its laws . . . Massachusetts began publishing its journals in 1715, again in a controversy with the governor, and put out a systematic compilation of the laws in 1742.95
While the effort to codify law may have not been aimed primarily to democratize access to the law, it was in retrospect a thankful consequence. Private citizens began making use of the text of the law in ways they could not before. According to Olson (1992), “Pennsylvanians annoyed with what they thought to be unfair practices on the part of flour inspectors in the 1760s confronted the inspectors with copies of the laws.”96
The law in 7th century AD Europe, under the Visigoths, provides the first instance of an open access law that I have found. At this point “data” was of course still 1,300 years into the future and even the printing press 900 years away. Written information in the 7th century was disseminated only at great pains through the scribe work of monks at a handful of monasteries.
The story of the first copyright law exemplifies the differences between then and today. When a monk copied the manuscript of a saint in 6th century Ireland, the reigning king decreed, “To every cow her calf, and consequently to every book its copy.” This decree ordered the monk to hand over his copy to the saint, and in so doing inventing the concept of copyright. But the more interesting event was the first appeal of a copyright ruling. The monk, unhappy with the decree, unleashed the military power of his family against the king, and he won.97 In these times when the loss of a single manuscript could be cause for an attack on the king, an open records law seems as though it would have made little sense, as the cost would have easily outweighed the benefit.
And yet, the promulgation of the law using price control was a part of public policy of the time. The Visigothic Code, written in Western Europe around 649-652 (but based on a legal tradition dating back well before that), set a maximum price that the Code itself could be sold for: “it shall not be legal for a vendor to sell a copy of this book for more than four hundred solidi,” or some $100,000–$400,000 today, the Code read. In setting a maximum price the Code seemed to intend to create wider access to the Code than would have otherwise occurred.
And yet a hint of its rationale can be found in another part of the Code. It also directed “bishops and priests to explain to the Jews within their jurisdiction, the decrees which we have heretofore promulgated concerning their perfidy, and also, to give them a copy of this book, which is ordinarily read to them publicly.”98 Given the enormous cost of creating a copy and low rates of literacy, I doubt this provision, the Code’s only provision for the free dissemination of the law, was carried out literally. But the law suggests that the purpose of the dissemination of the law was not to widen access to justice but instead to suppress dissidence. While this is the earliest open-records law that I’ve found, the legal tradition may have in any case ended when the Visigoths were replaced by the Moors less than a century later in 711.
The Origins of Government Spending Records
Open records practices can only occur if there can be an inexpensive but comprehensive infrastructure for information dissemination, and it was only 1,000 years later that we can start to trace a continuous history of open data. Modern open records laws probably drew more from 17th century China than any Western tradition of the time. Jean Baptiste du Halde wrote about the Chinese empire in the early 1700s:
Every three years they make a general review of all the Mandarins [officers] of the Empire, and examine the good or bad qualities that they have for government. Every superior Mandarin examines what has been the conduct of the inferior since the last informations have been given in, or since they have been in office, and he gives Notes to everyone containing praises or reprimands . . . They reward a Mandarin by raising him to a higher degree, and they punish him by placing him in a lower, or by depriving him of his office.
The reviews would then be passed up the chain of command, each officer adding his notes onto those of his subordinates. At the highest level, where an account of all of the officers of the empire was put together, the punishments and rewards would be set and instructions would be distributed back down the chain of command, all the way down to the common people.
[T]he Mandarins are obliged to put at the head of their orders the number of degrees that they are to be raised or depressed: For instance: I, the Mandarin of this city raised three degrees, or depressed three degrees, do order and appoint, etcetera. By this means the people are instructed in the reward or punishment that the Mandarin deserved.99
This first practice that du Halde was aware of was an interesting application of open records. Officers of the court were required to announce their own promotion or demotion in each of their orders.
The second remarkable practice that du Halde learned of was the Peking Gazette, published in the capital and distributed throughout the provinces of the empire. The gazette recorded punishments of officers, “expenses disbursed for the subsistence of the soldiers, the necessities of the people [probably care for the old and poor], the public works, and the benefactions of the prince,” and “laws and new customs that have been established.”100
Although the Peking Gazette appears to be a form of government disclosure and might have been seen that way by Western Enlightenment thinkers, its true purpose was surely for the emperor to “instruct the Mandarins how to govern,” as du Halde wrote.101 The gazette was most likely a form of government propaganda and control written in the form of an announcement.
The Freedom of Information in the Kingdom of Sweden and the United States
While the foundations of open records were present in the Visigothic Code, new practices in the American colonies, and the long tradition of the Peking Gazette, it was in the Kingdom of Sweden in 1766 that the wide dissemination of government records became a constitutional right.
Sweden was then a rare parliamentary government with a weak king, but it had not yet outgrown the common practice of the time of government-granted monopolies. Priest, farmer, doctor, and Enlightenment thinker Anders Chydenius, who would later promulgate offentlighetsprincipen, “the principle of publicity”102, had a problem with those monopolies. Chydenius’s home province in a remote part of the Kingdom had not received such a monopoly, and for the sake of free trade — or else for the sake of his own province’s well being — Chydenius demanded freedom of sailing at a local government meeting. His brief role in local politics was followed by a well-timed shift in political power which opened the door to his service in the national parliament in 1765–1766. There he continued to defend economic freedom and a new subject for him, the ability of the public to participate in the national debate.
Chydenius was inspired by the Chinese practices that he knew of through works by du Halde as well as the writing by one of his contemporaries, Anders Schönberg, who in the early 1760s called for the free publication of government documents, decisions, and voting records. But it was Chydenius as secretary of a committee on the freedom of the press that drafted what became the first known freedom of information act in history, combining both freedom of the press to publish as well as the right to access government information. These principles were enacted at the end of 1766 with much debate but no objection. Chydenius’s act guaranteed access to two types of government information, documents and records of votes:
6. [A]ll exchanges of correspondence, species facti, documents, protocols, judgments and awards . . . when requested, shall immediately be issued to anyone who applies for them.
7. [I]n order to prevent the several kinds of hazardous consequences that may follow from imprudent votes, likewise graciously decided that [judges] shall no longer be protected behind an anonymity that is no less injurious than unnecessary; for which reason when anyone, whether he is a party to the case or not, announces his wish to print older or more recent voting records in cases where votes have occurred, they shall, as soon as a judgment or verdict has been given in the matter, immediately be released for a fee, when for each votum the full name of each voting member should also be clearly set out . . . and that on pain of the loss of office for whosoever refuses to do so or to any degree obstructs it.103
The law only remained in effect until King Gustav III’s coup six years later. But it returned in various forms over the succeeding centuries. A Freedom of the Press Act is one of the four documents that comprise the current Swedish constitution.
Progress since 1766 has been relatively slow. Twenty-one years after Chydenius’s act we adopted our constitution here. It did not have a general provision for access to government information. It did call for each house of Congress to maintain a journal.
Each House shall keep a Journal of its Proceedings, and from time to time publish the same, excepting such Parts as may in their Judgment require Secrecy; and the Yeas and Nays of the Members of either House on any question shall, at the Desire of one fifth of those Present, be entered on the Journal.
Today called the Congressional Record, Congress’s journal has been known to contain records of events that never occurred.104 The second country to enact a FOIA law, after Sweden, was Finland, which had been a part of Sweden in 1766. Finland kept Chydenius’s spirit going through Russian control in the 19th Century and enacted its own law as a new country in 1919.105
It wasn’t until 1966 — two hundred years following Sweden — that we had a Freedom of Information Act (FOIA) here in the United States, the third such law in world history. Inspiration for FOIA came not from the ideals of European Enlightenment but from the expansion of the federal government during and after World War II, the resulting bureaucracy and record-keeping, and the increasing skill of the federal government at manipulating public opinion.106 (For more on the initial development of the modern open government movement, see Yu and Robinson (2012)107.) The burgeoning open government movement of the 1950’s and 1960’s was driven by the newspaper industry and its trade associations quite possibly with no knowledge of the precedent in Sweden. The enactment of the Freedom of Information Act here was, unlike the previous examples, motivated by idealistic principles of having an informed citizenry.
FOIA’s advocates worked for several decades with Congress and the executive branch on a compromise that created a default state of openness for government records with a few enumerated exemptions. The first compromise was targeting the executive branch only. William Matthews, editor and publisher of Tucson, Arizona’s Daily Star, wrote at the time, “As a matter of getting such a law through Congress, should we threaten that body by demanding that all committee meetings be open?”108 Members of Congress had little to worry about the Freedom of Information Act, which ultimately passed unanimously in the House, as the law left them alone. A later compromise created the conspicuous exemption for “geological and geophysical information,” which may have been insisted on, indirectly, by President Johnson, who may have been protecting the interests of the oil industry in his home state of Texas.109
Johnson only begrudgingly signed the bill later. In a signing statement he pushed back on public access to personal files and other sorts of documents. His worry, which I think was fair, was that some decisions could be made better if deliberations could remain private, essentially the doctrine of executive privilege.110
Delays and fees, such as documents copied at $1 per page, lead Congress to amend FOIA in 1974. But that wasn’t a good time for President Ford, who was in the middle of responding to The New York Times’ coverage of military leaks. Ford vetoed the changes to FOIA hoping to keep control over his office’s information, but Congress easily overrode the veto.111 There have been new laws strengthening right-to-know since then — Who Needs to Know? by Patrice McDermott (Bernan Press, 2007) is a good reference. But FOIA, and at the state level freedom of information laws (FOIL), have not kept up with technology in the least (though that’s not to say they don’t still serve an important purpose), and as I explained in Chapter 1 serve a very different need from open government data.
Most other countries didn’t follow suit in developing FOI laws until the 1990’s and early 2000’s.112
The 21st Century: Data Policy
The open government movement that arose in the mid 20th century had a major shift in the first decade of the 21st century largely due to the infusion of technologists into the movement. From a legal perspective, Data.gov, the Open Government Directive (discussed in Chapter 1), and open standards laws passed in Vancouver, Canada and Portland, Oregon all in 2009 marked the shift. In Vancouver:
Open and Accessible Data - the City of Vancouver will freely share with citizens, businesses and other jurisdictions the greatest amount of data possible while respecting privacy and security concerns; Open Standards - the City of Vancouver will move as quickly as possible to adopt prevailing open standards for data, documents, maps, and other formats of media;113
(see section 7.3 for a longer excerpt) and in Portland, Oregon:
[T]he Council of the City of Portland . . . [d]irects the Bureau of Technology Services to . . . [d]evelop a strategy to adopt prevailing open standards for data, documents, maps, and other formats of media;114
Progress since 2009 has been steady. In 2010, several more city governments picked up on the movement. San Francisco enacted a change to its municipal administrative code regarding open data policy. It was the first law to adopt language from the 8 Principles of Open Government Data and it called for technical requirements to be created for the purpose of “making data available to the greatest number of users and for the greatest number of applications,” with “non-proprietary technical standards,” and a “generic license” such as a Creative Commons license.115 (See section 7.4 for a longer excerpt. Unfortunately, a quick perusal of DataSF.org, a sort of Data.gov, shows that the city’s GIS data are all still hidden by an innocuous but non-generic click-through agreement.116) The City of Ottawa seemed to pass an open data motion that year as well,117 which in its accompanying report referred to the 8 Principles of Open Government Data. A similar bill like the San Francisco bill was introduced in the New York City Council118 — it was enacted into law more than two years later in March 2012. The law defines data and open standards, it incorporates ideas from the 8 Principles, and it requires public data sets to permit “automated processing and . . . to notify the public of all updates.”
The first law to my knowledge to incorporate the full 8 Principles is New Hampshire’s HB 418, originally introduced as HB 310 in 2011119 by an open-source-coder-turned-state-representative. The bill was enacted as HB 418 in March 2012, requiring state software acquisitions to consider open source software, requiring new data standards created by the state to be open standards, and directing the commissioner of information technology to develop state-wide information policies based on the 8 Principles.120 (See section 7.7 for an excerpt.) The bill’s open standards language was copied into Oklahoma bill HB 2197 which was enacted in April 2012.121 California SB 1002 (2012)122, which is currently pending in the California Senate, also defines open data drawing on the 8 Principles.
At the federal level progress is much slower. In 2010, H.R. 4858: The Public Online Information Act of 2010, or POIA, was introduced by New York’s Rep. Steve Israel, though in reality the brainchild of the Sunlight Foundation. Under POIA, records in the executive branch would be put online and an advisory committee for government-wide guidelines on Internet-enabled transparency would have been created. (POIA was re-introduced in 2011 by Montana Senator John Tester.) At the end of the year then-Illinois congressman Bill Foster, who lost reelection, introduced H.R. 6289: Legislative Data Transparency and Public Access Act of 2010. This bill should have been a no-brainer: It would have required the Library of Congress to publish its database that powers the THOMAS.gov website, and then I could get out of the business of screen-scraping THOMAS. Of course this bill, like the others, went nowhere. The executive branch renewed its commitment to open data in its 2012 Digital Government Strategy.123
In 2011 the New Zealand government approved comprehensive general principles for data management (including “open”, “well-managed”, and “reasonably priced”), which draws from several aspects of the 8 Principles for Open Government Data.124 A cooperation of the federal and local governments in Austria has endorsed the Creative Commons Attribution License for government data125, which requires attribution (and nothing else) for reuse of data. Data is being released on websites like Data.gov throughout the world, such as in Montevideo, Uruguay.126
Open government and data policy legislation is still evolving. Interestingly, it is the cities and states in the United States leading the legal frontier of open data here. And abroad, licensing rather than openness per se has seen the most traction.
5. Principles of Open Government Data
The House Committee on House Administration held a conference in early 2012 on legislative data and transparency. Reynold Schweickhardt, the committee’s director of technology policy, made an interesting observation at the start of the day that policy for public information often is framed in terms of 3 A’s:
-
accessibility,127
-
authenticity, and
-
accuracy.
They are good principles. And yet us data geeks and entrepreneurs so often find ourselves having to start from scratch explaining why clean data is so important. It seems contradictory: if accuracy is a concept practitioners in government get, and if ‘clean’ is a type of accuracy, then there must be some communications failure here if we’re having a hard time explaining open data to government agencies. What other word do we need to add to those 3 A’s to work open data in there? Some possibilities are precision, analyzable and reusable128, automatable, adaptable (see below), or normalized and queryable129. Being precise about what “open government data” means helps us formulate our asks when we approach governments and gives insight into what this new field is all about.
An open government working group convened by Carl Malamud in November 2007 was the first to attempt this. Its 8 Principles of Open Government Data130, included in full in section 7.1 and online at opengovdata.org, specified a working definition for what it means for public government data to be open. The Open Knowledge Foundation wrote an Open Knowledge Definition (OKD) at opendefinition.org (and reproduced in section 7.2) in 2006, which adapted a definition of open source software for sharing data.
Open government data might simply be the application of “open,” as in the sense of the OKD, to data held by the government. I find this too weak to be a definition of open government data. For instance, the OKD allows governments to require attribution on reuses of its data, which I believe makes government data not open (more on that later). Or, open government data might be the synthesis of “open government” and “data,” in which case it refers to data that is relevant to government transparency, innovation, and public-private collaboration. But perhaps the open government data movement cannot be decomposed according to its words. Justin Grimes has pointed out to me that, looking at its history, the movement has come out of three very distinct communities: classic open government advocates whose focus has typically been on freedom of information and money in politics, open source software and open scholarly data advocates, and open innovation entrepreneurs (who might include both Gov 2.0 entrepreneurs and government staff looking to the public for expertise, such as in Peer to Patent). To each group, “open” means something different.
Three communities using the same word for three different purposes inevitably lead to confusion. Yu and Robinson (2012) described the consequences:
The shift has real-world consequences, for good and for ill: Policies that encourage open government now promote a broader range of good developments, while policies that require open government have become more permissive. A government’s commitment to be more “open” can now be fulfilled in a wider variety of ways, which makes such a promise less concrete than it used to be. . . . A government could commit to an open data program for economic reasons—creating, say, a new online clearinghouse for public contracting opportunities.131
Beth Noveck, the professor and former U.S. deputy chief technology officer for open government, wrote in a blog post in 2011 of the trouble the ambiguity created for the goals that she had brought to the White House:
In retrospect, ‘open government’ was a bad choice. It has generated too much confusion. Many people, even in the White House, still assume that open government means transparency about government. . . . The aim of open government is to take advantage of the know-how and entrepreneurial spirit of those outside government institutions to work together with those inside government to solve problems.132
Yu and Robinson suggested breaking down open government data not into three parts but four, using two dimension. The first dimension ranges from transparency (i.e. data about government) to service deliverability (including data from the government). The second dimension ranges from “inert” data such as PDFs to “adaptable” data, by which they mean precise, machine processable data and APIs. Grimes’s “classic open government” would fall mostly in Yu and Robinson’s transparency–inert quadrant, open innovation would fall mostly in their service delivery–adaptable quadrant.
The confusion is not likely to be resolved by choosing one definition or the other, but instead by practitioners being more clear about their personal goals. My goal, and the theme of this book, is to treat open government data as more than just the sum of its parts: it is “Big Data” applied to Open Government. That means a definition must draw from not only open data (i.e. the OKD) and open government (transparency, innovation, and collaboration) but also from the qualities of Big Data. In the definition of Big Data that I adopted in Chapter 1, Big Data has two parts: 1) it is data at scale, and 2) it allows us to think about the subject of the data in a new way. Big Data data is data that is amenable to automated analysis and transformation into novel applications. If we are to add another A-word, it would be “analyzable.”
To summarize the rest of this chapter, open government data has the following defining qualities:
-
“Open” or “Accessible”:
Data must be online and available for free, in bulk, with no discrimination, and without the need to agree to a license that waives any rights the user might otherwise have.
-
“Big Data” or “Analyzable”:
The complexity of today’s governments necessitates the use of automation in any serious application or analysis of government data, such as to search, sort, or transform the data. Data must be machine-processable following the general guiding principle of making choices that promote analysis and reuse.
Properly implemented open government data also has these desired qualities:
-
“Open” or “Accessible”:
Data should use non-proprietary file formats appropriate for the intended use of the data, be documented, be posted permanently, and use safe file formats.
-
“Accurate” and other aspects of data quality:
Governments should provide the lowest-level granular data and should make data interoperable through coordination. Data should also maximize accuracy and precision at a reasonable cost to the data user.
-
“Authentic” and questions of process:
This category of principles addresses how a data release should address human needs such as relevance and trust. The principles include timeliness, digital provenance, the use of public input, the need for public review, the dangers of endorsements, and general priorities for government agencies.
In the next several sections, the defining and desired qualities of open government data are laid out in detail. This chapter wraps up with a definition of data quality and case studies of the principles applied in practice.
1. 17 Principles
The recommendations in this section address how to make public government data open, starting not with what should be open but what it means for data to be open and how to do it well. Public government data includes reports, audio/visual media, databases, transcripts, and other government records and products in digital form that have no privacy, security, or copyright ramification as given by the law. Government records that are not public, by law, are simply out of the scope of these recommendations.
Of the 17 recommendations that follow, machine processability and promoting analysis are the most crucial principles of open government data. Evaluating machine processability in terms of data quality — not only accuracy but also precision and cost — is discussed in section 5.2. Of note is that accuracy refers not to whether a digital record captures the physical details of an event or object but whether it captures facts in a way that admits reliable automated analysis.
1. Principles 1–4: The Basic Principles
1. Information is not meaningfully public if it is not available on the Internet for free.
Today, the first place many people turn for information is the Web and they expect to find government information there. If information can be obtained only by request in person, the information is essentially unavailable to the vast majority of citizens. Likewise, any fee for access greatly limits the availability of the information.
It is rapidly becoming suspect for government records, especially those that are relevant to government transparency, to be made available to the public only in person.
The federal Office of the Federal Register has been quite frank about how things were just a few years ago:
The physical version of the [Public Inspection] Desk inside the OFR [Office of the Federal Register] office near Capitol Hill was a battered old table with documents piled into wooden boxes. For 73 years we offered shoe-leather access — if you worked inside the DC Beltway, and let’s say you wanted to know how the Government was reacting to a financial crisis, you could hoof it over to the OFR and look for documents in the emergency filing box.
You might stand in line to read an item, then wait for a photocopier and hope it didn’t break down. You could try agency websites, but you could not rely on that material. It might not be current, and only the OFR had the original, which may have been modified by the agency at the OFR after our legal review ensured that effective dates made sense and CFR [Code of Federal Regulations] amendments were properly stated.133
They have since brought those documents online as part of Federal Register 2.0. But those conditions still exist elsewhere in the federal government. The House of Representative’s Legislative Resource Center, located in the basement of one of the House office buildings, is another one of those locations. And while much of their records began to go online in 2009 under pressure from the public, some still remains in print only, including samples of franked mail which are required to be submitted by congressmen for review.
What constitutes an appropriate fee for reuse of government information varies from culture to culture, and this principle may certainly be biased toward U.S. culture. In the United States expectations are particularly high for government transparency. Fees beyond the marginal cost of reproducing a document are viewed with suspicion, as if the fee is designed to impinge on the public’s ability to oversee its government. Fortunately there is essentially no marginal cost of online distribution for most government records, and so even for allowing marginal costs “public” means “online” and “free”.
The European Union Public Sector Information Directive (EU PSI Directive) sets a much lower standard: “(14) Where charges are made, the total income should not exceed the total costs of collecting, producing, reproducing and disseminating documents, together with a reasonable return on investment.” Although the directive does go on to recommend the marginal cost, the rule it actually sets allows EU governments to use public data for profit. (This perhaps is changing as the value of open data becomes better recognized. In a December 2011 speech by the vice president of the European Commission and commissioner for its Digital Agenda, the benefit of marginal cost was reaffirmed.134)
This first principle was adapted from Sunlight Foundation’s Principles for Transparency in Government135 and the “access” requirement of the Open Knowledge Foundation’s Open Knowledge Definition (OKD) at opendefinition.org (and reproduced in section 7.2). The recommendations below continue with those published by the Open Government Working Group (opengovdata.org), convened by Carl Malamud in November 2007. Here are its principles two through four.136 Data should be:
2. “Primary: Primary data is data as collected at the source, with the finest possible level of granularity, not in aggregate or modified forms.”
This principle relates to the change in emphasis from providing government information to information consumers to providing information to mediators, including journalists, who will build applications and synthesize ideas that are radically different from what is found in the source material. While information consumers typically require some analysis and simplification, information mediators can achieve more innovative solutions with the most raw form of government data.
One often finds that the only open access to audio, video, and images are at low resolutions for the purpose of making them suitable to viewing on a website. While this is an important use case, publishers of open data have an obligation to make the full-resolution information available in bulk to support additional applications such as the creation of professional media and archiving. That may be in addition to making available a low-resolution format. For instance, Congressional committees generally offer live low-resolution streaming video of committee events, and some committees additionally offer separate access to high-resolution archival footage.137 In the case of government reports, separate documents should make available any underlying data used in the analysis. For instance, the U.S.Census Bureau Census Bureau publishes reports (i.e. PDFs) about the nation’s demographics as well as comprehensive, raw, tabular data downloads that researchers can analyze for their own reports on other subjects.
In other words, when applying these principles to media such as documents and audio/visual recordings, one must consider the dual role of media: On the one hand, as part of the agency’s website they are a component of the agency’s communications strategy. Because of this, web media must be available in formats suitable for display in a web browser and should be easily locatable through search. But web media is often also a government record. Reports and video archives, for instance, are of interest not just to visitors to the agency’s website but also to journalists and technologists who may want to analyze them in ways not supported by a method of publishing intended for a web audience. For instance, web video is often played at a lower resolution than what was originally recorded. And documents may be displayed as a digitally signed PDF for ease of authentic reading and printing, but other source formats may be more useful for research. Web media must often be made available in multiple formats suitable for these different purposes.
3. “Timely: Data are made available as quickly as necessary to preserve the value of the data.” Data is not open if it is only shared after it is too late for it to be useful to the public.
What is a reasonable level of timeliness depends on the nature of the data set. Data relevant to an ongoing policy debate requires higher standards of timeliness. Timeliness is not just that data is available once, but that data users can find updates quickly. RSS feeds can help notify users of new content, and data should explicitly include a list of recent changes to the format and content.
The American Association of Law Libraries’s Principles & Core Values Concerning Public Information on Government Websites138 notes that information can be current but users of the information may be unable to tell. It is as important for users to know the data is current as for the data itself to be current. Their principles state, “Government websites must provide users with sufficient information to make assessments about the accuracy and currency of legal information published on the website.”
4. “Accessible: Data are available to the widest range of users for the widest range of purposes.” The accessibility principle covers a wide range of concerns including the need for the user of the data to be able to locate, interpret, and understand it and through software to be able to acquire and decode it.
The choice of data format has wide implications for what applications can be built on top of the data, what usage restrictions may result from data format patents, and whether archived data is likely to be usable in the future when we may not have access to the same software we do today. Data must be made available in formats that support both intended and unintended uses of the data by being published with current industry standard protocols and formats, preferably open, non-proprietary protocols and formats. Open formats tend to have lower barriers to use and also ensure that we have the knowledge to be able to decode the data when the current software for that format is no longer available. This principle is also related to the OKD’s “access” and “absence of technological restriction” requirements.
If the data is accessible through an interactive interface, it must also be possible to download the complete data set in raw form and in bulk through an automated process (i.e. a bulk data download). If the data set is distributed across multiple locations, for instance if the requirement of publication is spread across multiple agencies or offices, then the automated part becomes much more important, since parts of the complete data are far less useful in isolation. The ability to locate parts of a data set is called discoverability and is strengthened by techniques such as well-known locations, sitemaps, and use of common formats and standards. Common methods of making data available are simple links to downloadable files, the use of an anonymous FTP (File Transfer Protocol) server, and for data with frequent updates an rsync or version control server (e.g. Subversion or Git).
Data must be provided with sufficient documentation so that the data user understands the structure of and abbreviations in the data. Documentation may assume some level of subject domain expertise but should not assume knowledge of internal agency practices. On the House Statement of Disbursements website, there is a thorough explanation of how expenditures are tracked by the House and a separate glossary of 42 terms that are either obscure or are used in unusual ways by the House accounting system.139
An “API” provides access to slices of data and often requires registration first (see principle 6 below), so an API typically does not meet the requirements of access. The exception is when a data set is so large so as to be not practically downloadable in bulk. By today’s standards, that would be a data set at least 10 gigabytes in size, or about 6 hours on a broadband connection. Of course an API may still be very useful, but bulk data should be available first. (The Australian Governments Open Access and Licensing Framework makes an API a core part of data access, placing its recommendation under the heading “open query.” This is a much higher standard of technological openness than most of the other principles in this section, and in fact the framework goes so far as to recommend the use of a SPARQL endpoint — SPARQL is the query language for RDF, Linked Open Data, and the Semantic Web.140 However, SPARQL is a largely untested approach. A good example of an API to use as a model is Sunlight Foundation’s Real Time Congress API.)
2. Principle 5: Data Format Matters
The 8 Principles of Open Government Data also say that data should be:
5. “Machine processable: Data are reasonably structured to allow automated processing.”
The goal of this principle needs some unpacking. Before the 8 Principles of Open Government Data were published, the term I heard most often for this was “machine readable.” At the workshop, Aaron Swartz pointed out that any data can be read by a machine and that it is not the reading of the bytes that is important to openness but whether the machine can usefully process it. The group adopted “processable” instead. The machine-processable principle is important because as the sizes of data sets grow, the most interesting, informative, or innovative applications of government data require the use of a computer to search, sort, or transform it into a new form.
But as powerful as computers are, they don’t work well with uncertain data. For instance, human language is remarkably uncertain at least from the point of view of the computer. It doesn’t know what any of this text means. Prose to a computer is like poetry to me. I just don’t get poetry. When I read a poem I need someone to explain to me what it means and how it is meant to be interpreted. And so it is for a computer. There is no meaning to a computer besides what a programmer gives it. Give a computer audio or images and without the proper software a computer is like an octopus suddenly relocated into the middle of Times Square. Its mind could not begin to make sense of the signals coming from its eyes. (The refined octopus would ask of Times Square “why?”, but your common octopus would have no idea what is going on.) Think of how each type of computer file can be opened only in the software it was meant for: Microsoft Word documents are opened in Microsoft Word, PDFs are opened in Adobe Acrobat, and so on. Data is nothing without the ability to create software to process it.
Sometimes government data falls into a category for which there is an appropriate, standard data format — and corresponding application. Tabular data, such as spending data, can be saved into a spreadsheet format (e.g. Microsoft Excel or, better, the CSV format). Saving it in this format, compared to a scanned image of the same information, creates certainty. Programmers know how to make programs that work reliably with numbers in rows and columns. Software already exists for that. There is no reliable way to work with the same information when stored in a scanned image.
But other government data doesn’t fit into a standard data format. When the relationships between things encoded in the data become hierarchical, rather than tabular, it is time to think about using a dialect of XML. For instance, an organizational chart of a government department is hierarchical and would not fit nicely into a spreadsheet. The information could be typed into a spreadsheet, but whether you can figure out how to interpret such a spreadsheet and whether a computer has been programmed to interpret and process it are not the same. Much like the difference between poetry and prose, the use of an incorrect format can render the data completely opaque to software that could process it.
The principle of machine processability guides the choice of file format — free-form text is not a substitute for tabular and normalized records, images of text are not a substitute for the text itself — but it also guides how the format is used. When publishing documents it is important to avoid scanned images of printed documents even though scanned images can be included in a PDF, and PDF is a recommended format for certain types of documents. A scanned image is an uncertain representation of the text within it. An RSS or Atom feed of a schedule encodes dates and times with certainty, but it does not provide a way to include a meeting’s location or topic in a way that a computer could meaningfully process. If those fields are important, and that will depend on what will be done with the feed, then the feed will need to be augmented with additional XML for that purpose.
XML is best thought of as a type of data format, rather than a particular format. There are many ways to apply XML to any particular case, and the choices made in applying XML should continue to be guided by the principle of machine processability. For instance, the following is a poor XML representation of two scheduled meetings:
<schedule>
<meeting>The committee will hold a hearing next Thursday to consider unfinished business on the defense appropriations bill.</meeting>
<meeting>The markup on the Public Online Information Act will resume at 10am on Friday.</meeting>
</schedule>
(Boldface is added for clarity and is used below to highlight changes.)
This representation merely encloses a description of the event in words in “tags” surrounded by angled brackets (the tags are in boldface for clarity). Angled brackets are the hallmark of XML. If you are not familiar with XML, note how each “start” tag corresponds with an “end” tag of the same name but with a “/” indicating it’s an end tag.
The example above is well-formed XML. However, it is a useless use of XML because the information expressed in words is difficult or impossible to program a computer to extract with any reliability. A better use of XML would identify the key terms of the description with additional tags that with sufficient documentation a programmer could program a computer to locate reliably. Here I add who, what, when, and subject tags that wrap particular parts of the meeting information:
<schedule>
<meeting><who>The committee</who> will hold a <what>hearing</what> <when>next Thursday</when> to consider unfinished business on the <subject>defense appropriations bill</subject>. </meeting>
<meeting>The <what>markup</what> on the <subject>Public Online Information
Act</subject> will resume at <when>10 am
on Friday</when>.</meeting>
</schedule>
Now if there are only ever two meetings to deal with, it’s easy enough to process this information: get an intern to type it into a spreadsheet. But imagine the same question asked of tens of thousands of meetings in all of the parliaments world-wide. With the right XML, it’s easy to create an automated process to locate all of the subjects because the format commits the author to using the precise text “<subject>” to identify subjects. XML creates reliability through standardization.
Still, so far it is impossible to figure out the dates of these meetings when ambiguous terms like “next Thursday” are used. How would a computer identify all of the meetings coming up in August 2011? We can use additional standard date representations to clarify this for automated processing. And the same problem can be addressed for naming bills in Congress (there are often multiple bills with the same name or the same number!).
. . .
<meeting>
The <what>markup</what> on the
<subject bill="http://hdl.loc.gov/loc.
uscongress/legislation.112hr1349">
Public Online Information Act</subject> will
resume at <when date="2011-07-08T10:00:00-400">10 am on Friday</when>.</meeting>
. . .
I’ve added so-called XML “attributes” to add additional information to the tags. The new date attribute specifies the date (“2011-07-08”), 24-hour time (“10:00:00”), and timezone (“-400”, meaning four hours before UTC) of the meeting in a date format that has been created by an international standards body. The new bill attribute reliably identifies the bill to be discussed, using “http://hdl.loc.gov/loc.uscongress/legislation.112hr1349” to indicate the bill clearly, rather than the bill’s title alone, which is ambiguous. This is sometimes called normalization: the process of regularizing data so that it can be processed more reliably. Again, standardization creates certainty in computer processing. That certainty is required to produce useful results out of data. And as this example shows, the devil can be in the details. While XML is often the recommended data format, it is entirely in how the particular XML is crafted that determines whether the data will be usefully machine processable.
The choice of file format involves a consideration of both access and machine processability. Figure 21 lists recommended formats for different types of media, glossing over the details discussed previously. For tabular data such as spreadsheets, CSV (“comma separated values”) is the most widely usable format.141 It is simply a text file with commas delimiting the columns. In the case of tabular data, simplicity is key.
There is no one answer for the appropriate file format for documents because of two often competing requirements: being print-ready (e.g. including pagination, layout, etc.) and encoding the content in a machine-processable way. The PDF format is always print-ready (PDF/A-1b is the specific minimum requirement for documents that need to be archived), but PDF normally does not make the information contained in the document machine-processable. While “Tagged PDF” (PDF/A-1a) could achieve both goals simultaneously, most software that supports PDF output does not adhere to PDF/A-1a. It is therefore necessary in some cases to publish a document in two formats simultaneously, once in PDF to satisfy the needs of printing and once in a format such as XHTML or XML. As I noted above, however, the use of XML does not guarantee machine processability: it’s in how the XML is used.
For images, audio, and video the overriding concern is using a non-proprietary format, for the reasons discussed in the accessibility section. The most useful non-proprietary formats are PNGs for images and Ogg for audio and video.
When dealing with heterogeneous data — such as entities with arbitrary relationships between them that defy a simple hierarchy — then the semantic web format RDF may be most appropriate (more on that later).
Machine processability also implies that the data should be clean. The smallest of mistakes in the data can dramatically increase the cost of use of the data because fixing mistakes almost always requires human intervention: making the data not machine-processable. This isn’t to say the data must be correct. Data that has been collected, e.g. a survey or a measurement, can be reported as it was collected when it has uncorrectable errors or when correction involves judgment. Data is clean when its data format has been appropriately applied and when its values are normalized.
Machine processability is closely related to the notion of data quality. For more, see section 5.2.
3. Principles 6–8: Universality of Use
The remaining principles from the 8 Principles of Open Government Data are as follows. Data should be:
6. “Non-discriminatory: Data are available to anyone, with no requirement of registration.” Anonymous access to the data must be allowed for public data. This principle is also related to the OKD’s "no discrimination" requirements.
7. “Non-proprietary: Data are available in a format over which no entity has exclusive control.” Proprietary formats add unnecessary restrictions over who can use the data, how it can be used and shared, and whether the data will be usable in the future.
While there is nothing wrong in principle with exclusive control over a data format, proprietary formats are troublesome for open data because data is not open if it is not open to all. A document released for the word processing application Pages will only be open to individuals who can afford to own a Macintosh computer. It can only be used in ways supported by the Pages program. And looking ahead, since government documents should be archivable, it will only be able to be opened so long as the company Apple still exists and continues to support its Pages application. Proprietary formats create practical restrictions that open, non-proprietary formats do not. Non-proprietary formats are often supported by a wider range of applications, and therefore support a wider range of uses and users.
Writing in 2012, Kevin Webb of OpenPlans encountered a problem using geospacial (GIS) data considered nominally open from the U.S. Geological Survey. He wrote:
Several weeks back I needed to make a map for a big chunk [of] the Pacific Northwest. I leveraged all kinds of useful open data (OSM for streets, Lidar from local governments, etc.) but above all else I needed really good stream and river data. Lucky for me the USGS maintains a detailed data set that maps every stream and pond in the entire U.S., even the tiny intermittent ones!
I’ve been working with GIS tools and data in a professional capacity for going on fifteen years and I consider myself pretty savvy. However, over the last decade all of my work has come to depend on open source GIS tools—my ArcGIS license and the parallel port dongle it required stayed behind when I left university. So while I can tell you all about spatial indexes and encoding formats for transmitting geometric primitives, I missed the memo on ESRI’s new File Geodatabase format; the format now being used to manage and disseminate data at the USGS.142
The new Geodatabase format has become the standard data format for GIS information, replacing the open Shapefile format, Webb wrote. Unfortunately, the only software capable of opening Geodatabase files is the software produced by the company who created the format, ESRI, which sells its software for $1,500. There is nothing wrong with ESRI keeping its formats proprietary to induce potential buyers to pick up its software. But the USGS’s choice to use a proprietary format reduced the value of the data to the public substantially.
Use of proprietary formats may also constitute a form of endorsement that may create a conflict of interest. While some proprietary formats are nearly ubiquitous, it is nevertheless not acceptable to use only proprietary formats, especially closed proprietary formats. On the other hand, the relevant non-proprietary formats may not reach a wide audience. In these cases, it may be necessary to make the data available in multiple formats.
Commonly used proprietary formats are Microsoft Office documents through version 6, the audio format MP3, and the video format WMA. These data formats should be avoided. Although the PDF format was originally proprietary, it has since been taken over by a standards body making it an open, non-proprietary format, although it may not satisfy the machine processable principle. The current Microsoft Office formats are open and nominally non-proprietary.
CSV, OpenOffice document, XHTML, most XML, and Ogg are all non-proprietary formats.
8. “License-free.” Dissemination of the data is not limited by intellectual property law such as copyright, patents, or trademarks, contractual terms, or other arbitrary restrictions. While privacy, security, and other concerns as governed by existing law may reasonably limit the dissemination of some government data, that data simply does not meet the standards of openness. Only data not subject to a license is open. Every effort should be made to make non-restricted portions of otherwise restricted documents available under these principles. This principle is a stronger version of the OKD’s “redistribution” and “reuse” requirements.
Just as with what constitutes appropriate fees, appropriate license terms vary from culture to culture. This principle, too, may be biased toward U.S. culture. In the United States, the ideal of “free speech” places a considerable restriction on the government to not use the law to prevent the dissemination of information, especially information related to the government. For instance federal government-produced documents are generally excluded from copyright protection.143
Still, the principle is rarely executed correctly. Data.gov, which is a catalog of government datasets, imposes a terms-of-use agreement on all its data sets. It reads, “By accessing the data catalogs, you agree to the Data Policy,”144 and the Data Policy requires users of the data to include a disclaimer in their applications: “Finally, users must clearly state that ‘Data.gov and the Federal Government cannot vouch for the data or analyses derived from these data after the data have been retrieved from Data.gov.’ ”145 This is the only requirement the Data Policy places on data users. (It is buried within eight other paragraphs setting out expectations for the agencies submitting the data, but of course those other paragraphs are eviscerated of any legal force by a disclaimer in the final paragraph.) A disclaimer is relatively innocuous, and yet putting words into the mouths of those disseminating government information is a free speech issue. In the Citizens United case before the Supreme Court, the Court noted that “[d]isclaimer and disclosure requirements may burden the ability to speak” (though it upheld the electioneering disclaimer requirements in question on the grounds that it keeps voters informed).146 In any case, the disclaimer requirement is enough to violate the license-free principle of open data.
The EU PSI Directive notes that licenses covering government data may consider “liability, the proper use of documents, guaranteeing non-alteration and the acknowledgment of source.” Any of these provisions would violate the license-free principle stated here.
In many European countries and at the state-level in the United States, the government holds a copyright over works it produces, though commonly with exceptions for the law itself.147 In jurisdictions that impose a government copyright (such as crown copyright), open government data should be explicitly dedicated to the public domain. The Creative Commons CC0 is a universal legal instrument that is appropriate to waive intellectual property rights on government works.148 In these cases, the “license-free” principle is perhaps misworded, since a license may be needed to un-do the restrictions imposed by copyright law.
The license covering Data.gov.uk’s catalogue, the U.K. equivalent of our Data.gov, may be used as model language for granting permissive use of government data. The license grants the right to:
-
“copy, publish, distribute and transmit the Information;
-
adapt the Information;
-
exploit the Information commercially for example, by combining it with other Information, or by including it in your own product or application.”
But the license also requires attribution, a link back to the license, and, well, truthfulness: the license requires that the user not “suggest[...] any official status” or “mislead others or misrepresent the Information.”149 (The trouble with a legal requirement of truthfulness is that truth is often subject to interpretation. Governments have no business regulating truth for truth’s sake. Other regulations of truth, such as in commerce and defamation, involve some actual harm.) So it comes short of waiving all intellectual property protections.
The New Zealand Government Open Access and Licensing Framework, approved in August 2010, recommends a different Creative Commons license, one that requires the data user to attribute the data back to the government:
State Services agencies should make their copyright works which are or may be of interest or use to people available for re-use on the most open of licensing terms available within NZGOAL (the Open Licensing Principle). To the greatest extent practicable, such works should be made available online. The most open of licensing terms available within NZGOAL is the Creative Commons Attribution (BY) licence.150
A cooperation of the federal and local governments in Austria in 2011 endorsed this Creative Commons Attribution License for government data151, which requires attribution (and nothing else) for reuse of data. On a strict reading of the license-free principle, any such restrictions would make the data not open. Pragmatically, the fewer restrictions the better.
4. Principles 9–12: Publishing Data
9. Permanent: Data should be made available at a stable Internet location indefinitely. Providing documents with permanent web addresses helps the public share documents with others by allowing them to point others directly to the authoritative source of the document, rather than having to provide instructions on how to find it, or distributing the document separately themselves. Permanent locations are especially useful on government websites which are prone to being scratched and re-created as political power shifts.
A common format for permalinks to documents, which is used at most newspaper websites, is “www.agency.gov/year/month/day/name.doc.” Web addresses of this form give a clue about the date and nature of the document which helps users verify that they have the right link. The League of Technical Voters proposes that web addresses be used to help distinguish document versions by having a different but related web address for each published version of a document, as well as in the extreme case to identify paragraphs within documents (see citability.org). The American Association of Law Libraries’ principles call permanent addresses “persistent URLs (PURLs)” — although PURLs are usually short-URLs that can updated at any time to redirect to the current location of a resource. The use of redirecting URLs should be a last resort when a persistent, descriptive URL cannot be created.
When data changes over time, persistence means 1) retaining copies of all published versions of the data, and 2) maintaining stability of format from version to version. Changes to a data format should strive to be backwards compatible and use a two-stage deprecation process: warn first, then change.
The Association of Computing Machinery’s Recommendation on Open Government (February 2009)152 includes three unique principles:
10. Promote analysis: “Data published by the government should be in formats and approaches that promote analysis and reuse of that data.” Although I have discussed this throughout, it is worth emphasizing that the most critical value of open government data comes from the public’s ability to carry out its own analyses of raw data, rather than relying on a government’s own analysis. Most of the other principles relate to promoting analysis.
11. Safe file formats: “Government bodies publishing data online should always seek to publish using data formats that do not include executable content.” Executable content within documents poses a security risk to users of the data because the executable content may be malware (viruses, worms, etc.).
Even with anti-virus software installed, malware is spread easily through file formats that contain natively executable code (.exe’s on Microsoft Windows), macros with full access to the user’s computer (Microsoft Office documents with macros enabled), and in rarer cases formats that permit scripting languages (PDFs) because such formats are prone to bugs. In many cases the best protection for a user is to simply not open files that may contain executable content. Governments should not ask a user to choose between their security and access to government information, and so open government data should avoid these formats.
The most common violation of this principle has been the use of Microsoft Office documents with macros. These macros were once a widely used method of spreading computer viruses. This is rarer today, in part because of more useful security settings available in Microsoft products, and in part because since Microsoft Office 2007 documents with macros are saved in .–m files (.docm, .xlsm). The new file naming convention ensures document creators and document users can be sure that their files do not contain executable content. Documents that end in .–x (.docx, .xlsx) do not contain executable content and therefore satisfy the principle of safe file formats.
It is not widely known that the PDF format may contain executable content in the form of Javascript. Malware has been spread through Javascript in PDFs.153 While it is of course possible to create a PDF without Javascript, the user opening the document has no way to know whether any particular PDF is safe before opening it — by which point it may be too late. I am hesitant to call PDF an unsafe file format because of its enormous value for other reasons and the low incidence rate of PDF malware. But it cannot be called a safe file format.
12. Provenance and trust: “Published content should be digitally signed or include attestation of publication/creation date, authenticity, and integrity.” Digital signatures help the public validate the source of the data they find so that they can trust that the data has not been modified since it was published.
Establishing provenance and trust in a machine-processable way is important for static information, but it is actually incompatible with the goal of re-analysis. A digital signature is a method to ensure that, byte for byte, the data you have is the same as the data published by the source. However, as I’ve argued throughout, it is the transformation of data into new forms by mediators that makes data most powerful. That necessarily changes the bytes. Digital signatures are useful in the direct relationship between the data publisher and the data consumer and should be used on source documents, but they cannot be used to maintain a sense of authenticity in re-uses of the data.
The value of digital signatures on source documents should not become a reason to hinder the sort of changes that need to be made to source documents to create innovative applications.
5. Principles 13–17: On The Openness Process
The above twelve principles essentially define open government data in its ideal form, but more can be said about the process of opening up government data. How should government agencies decide what to open and how to do it?
13. Public input: The public is in the best position to determine what information technologies will be best suited for the applications the public intends to create for itself. Public input is therefore crucial to disseminating information in such a way that it has value. As the Association of Government Accountants’ principles154 state, “Understand the information that people want, and deliver it. They may not be sure what they need, so help them define it.”
14. Public review: The Association of Government Accountants’ principles also note that not only should the data itself be open, but the process of creating the data should also be transparent: “Have a process for ensuring that data you disclose are accurate and reliable, and show that process to users.”
15. Interagency coordination: Interoperability makes data more valuable by making it easier to derive new uses from combinations of data. To the extent two data sets refer to the same kinds of things, the creators of the data sets should strive to make them interoperable. This may mean developing a shared data standard, or adopting an existing standard, possibly through coordination within government across agencies. The use of open data formats often, but not always, entails interoperability. However, we recognize that interoperability can come at a cost. Governments must weigh the advantages of distributing non-interoperable data quickly against the net gain of investing in interoperability and delaying a release of the data.
16. Technological choices can be a type of endorsement. Endorsements of technology created or controlled by the private sector can create a conflict of interest when regulating that sector, and creates an incentive for endorsed corporations to be involved in policymaking. Other things being equal, technological choices should be avoided that essentially endorse a single entity.
17. Prioritization. Although the principles of open government data are written in the form of a definition, it would be a mistake to treat openness as a binary value. Government agencies have limited resources with which to prepare data for public consumption, and it would be impossible for all government data to meet these standards of openness instantaneously and simultaneously. Cataloging, documenting, preparing an infrastructure for distributing updates, and in some cases reviewing and redacting all require significant effort, and prioritization. A timely release of data might outweigh the desire for greater precision in the data, for instance the difference between a scanned image versus a database. In our world of limited resources, an incremental plan for achieving best practices is needed.
In Government Data and the Invisible Hand (Robinson et al 2009), a controversial point was made:
[T]o embrace the potential of Internet-enabled government transparency, [one] should follow a counter-intuitive but ultimately compelling strategy: reduce the federal role in presenting important government information to citizens. Today, government bodies consider their own websites to be a higher priority than technical infrastructures that open up their data for others to use. We argue that this understanding is a mistake. It would be preferable for government to understand providing reusable data, rather than providing websites, as the core of its online publishing responsibility.155
Governments are limited in what they should do, and in how fast they can do it, but the private sector — which has an established role in promoting civic engagement — can move quickly into applications governments won’t. Robinson et al’s point was not that a government agency should not provide services over the Internet, only that the agency should first publish its data to encourage innovation in the private sector, which might develop services better than those the agency itself could.
The infrastructure that the agency creates to publish to the private sector can and should be used by the agency itself to access its own public information. It is a common practice in technology companies to use your own software in order to make sure it works:
Such a rule incentivizes government bodies to keep this infrastructure in good working order, and ensures that private parties will have no less an opportunity to use public data than the government itself does.156
These ideas naturally lead to the following order of priorities:
-
Government agencies should first establish a basic public-facing website to meet critical and mandated needs to service the public.
-
The agency’s policy regarding open data and web best practices should be established, for instance by the agency’s Chief Information Officer, in consultation with the public.
-
Comprehensive bulk data access to public records maintained by the agency should be made available with the target audience as mediators, such as journalists, researchers, and technologists.
-
The agency website should then be expanded to include non-critical functionality, such as advanced search capabilities, and should rely on the same technical infrastructure created in the last step for its own access to its public records.
-
The last priority is for the agency to develop APIs and web services, which allow for third-parties to automatedly search, retrieve, or submit information without first acquiring the bulk data.
Whether or not these priorities are sensible in any particular instance will depend on the resources and expertise available to the agency.
6. Other Practical Guidelines for Web Pages and Databases
The recommendations in this section address more narrow concerns about websites and databases and should be addressed only after the preceding principles are applied.
Google has made several recommendations from the point of view of web search.157 The ability for the public to find government information is a crucial part of government information being open. Their first recommendation is to use their Sitemaps protocol which helps search engines crawl websites more deeply and efficiently. Their second recommendation was to review whether search engines are blocked from parts of an agency’s website by a robots.txt file, which describes the agency’s policy regarding automated access to their website. A robots.txt file should be used sparingly so as not to limit the public’s ability to gather data from the agency or gather data about the agency. As noted by Webcontent.gov, restricting access with a robots.txt file may be contrary to an Office of Management and Budget memorandum in the United States.158
Permanent web addresses (discussed earlier) are a part of a larger picture of using globally unique identifiers (GUIDs). This concept is that any document, resource, data record, or entity mentioned in a database, or some might say every paragraph in a document, should have a unique identification that others can use to point to or cite it elsewhere. A web address is a globally unique identifier. Any web address refers to that document and nothing else, and this reliability promotes the dissemination of the document as it provides a means to refer to and direct people to it. GUIDs that persist across database versions allow users of the database to process the changes more easily. If two datasets use a common set of GUIDs to refer to entities, such as campaign donors, then the value of the two datasets becomes more than just the sum of their parts. The connections between the databases adds great value to how they can be used. An easy (and accepted) way to choose GUIDs is to piggy-back off of your agency’s web domain, which provides a space of IDs for you to choose from that won’t clash with anyone else’s IDs. For instance, you may coin verbose GUIDs for entities such as "http://www.youragency.gov/guids/john_smith", rather than a simple, opaque, and non-globally-unique numeric ID "12345". Such GUIDs are a form of URI (uniform resource identifier), but the important part is that they are simply a unique identifier.
The use of GUIDs in the form of URIs is a part of a technological movement called Linked Open Data (LOD, see linkeddata.org). Promoted by the creator of the Word Wide Web, Tim Berners-Lee,159 the LOD method for publishing databases achieves data openness in a standard format and the potential for interconnectivity with other databases without the expense of wide agreement on unified inter-agency or global data standards. LOD is a practical implementation of Semantic Web ideas, and several tools exist to expose legacy databases and spreadsheets in the LOD method. Though I have been writing about the uses of the Semantic Web for government data160 for as long as I’ve been publishing legislative data, it has not caught on in the United States, though it has become a core part of Data.gov.uk and is a recommendation of the Australian Governments Open Access and Licensing Framework161.
The W3C working draft Publishing Open Government Data162 and the Linked Data Cookbook published by the W3C Government Linked Data committee163 provide additional best practices with regard to GUIDs and Linked Open Data.
2. Data Quality: Precision, Accuracy, and Cost
Many of the principles of open government data relate to a notion of data quality, meaning the suitability of the data for a particular purpose. Timeliness, for instance, is important if the data is to be useful for decisions in ongoing policy debates, but what constitutes “timely” depends on the particular circumstances of the debate. The choice of data format similarly depends on the purpose. For financial disclosure records, a spreadsheet listing the numbers is normally more useful than an image scan of the paper records because the intended use — searching for abberations — is facilitated by computer processing of the names and numbers. If the most important use of the records were instead to locate forged signatures, then the image scans would become important. Data quality cannot be evaluated without a purpose in mind.
Government data normally represents facts about the real world (who voted on what, environmental conditions, financial holdings) and in those cases two measures become important: precision and accuracy. Precision is the depth of knowledge encoded by the data. Precision comes in many forms such as the resolution of images, audio, and video and the degree of dis-aggregation of statistics. Accuracy is the likelihood that the data reflect the truth. A scanned image of a government record is 100% accurate in some sense. But analog recordings like images, audio, and video have low precision with regard to the facts of what was recorded, such as the numeric values in images or the participants in recorded meetings. In many cases, there is no automated method to extract those details. Therefore, with regard to automated analysis, these details are not encoded by the data — the data is not precise in those ways.
Government agencies have long prioritized accuracy in information dissemination. However, accuracy as defined here is a more nuanced notion by making it always relative to a particular purpose. In other words, recordings are 100% accurate in the sense that they record physical events or objects reliably. A photo does not lie. If the intended purpose of the recording is to re-witness the event or object, then it has 100% accuracy. But if the intended purpose is to support the analysis of government records to create oversight, then the colors, volumes, and other physical details present in the recording are not relevant for judging accuracy. What is relevant are the facts that were recorded, such as who the parties were in a transaction and the dollar amount that was exchanged. An image recording of a typed physical document, i.e. a scan, has low accuracy with regard to these facts because automated analysis of a large volume of such records could not avoid a large number of errors. OCR (optical character recognition) software to “read” the letters and numbers in a scan will occasionally swap letters, yielding an incorrect read of the facts.
Precision is often at odds with wide public consumability. A prepared report, which is still data, may be easily consumable by a general audience precisely because it looks at aggregates, summarizes trends, and focuses on conclusions. Therefore a report has low precision. The same information in raw form, at high precision, can be used by specialists such as developers, designers, and statisticians who can write articles, create infographics, or transform the same information into other consumable forms. The two ends of this spectrum are often mutually exclusive. A government-issued report in PDF format, say on environmental conditions, may be the most consumable for the public at large. But at the same time it provides little underlying data for an environmental scientist to draw alternative conclusions from. On the other hand, a table of worldwide temperature measurements would be of little value to the public at large because only environmental scientists understand the climate models with which conclusions can be reached, and in collaboration with a designer could create a compelling visual explanation of climate change.
When discussing open government data, the principle of promoting analysis is primary when considering data quality. Large volumes of data are useless if they cannot be analyzed with automated, computerized processes. Therefore when using terms such as accuracy and precision for data, they are always with respect to some automated process to analyze the facts in the data. They do not refer to whether a recording captured the physical details of events or objects.
In a structured data format such as XML, greater precision breaks fields down into more subcomponents, for instance the difference between a single field for a name versus breaking the field down into first, middle, and last name. Names are particularly difficult to process in an automated way because they are so idiosyncratic: for instance, Congresswoman Debbie Wasserman Shultz is “Rep. Wasserman Schultz” not “Rep. Shultz” as you might think if you weren’t already familiar with her name. A more precise way to identify an individual, beyond a name, would be through a numeric identifier that relates the individual to other occurrences in other datasets. Greater precision is always better, other things being equal, but if the intended use of the data does not require processing names then we might not expect extra effort to be spent increasing the precision of names.
Precision and accuracy are intertwined with cost on both the producing and consuming ends. For the very same database, it may be possible to achieve high precision and high accuracy in processing the data, but only at high cost. When we ask for a database with high precision and high accuracy, we mean at a reasonable price.
Let’s say the intended purpose of some data requires displaying the last name of each named individual in the dataset. In some cases, even if the names are given in a single combined field (“Debbie Wasserman Schultz”) it may be possible to determine the last name (“Wasserman Schultz”) with 100 percent accuracy. However, to do so might require hiring an intern to call up each individual and ask what exactly his or her last name is. In this case, precision and accuracy are very high, but so is cost. If the intern calls only half of the individuals and guesses for the rest, the precision stays the same, but accuracy would be reduced, meaning there is some chance the interpretation of the data will contain errors. But that’s what you can get by halving the cost.
When government records are released as scanned images, the content of those records might be converted to text with high precision and accuracy using expensive OCR software (or human transcribers) or with low precision and accuracy using open source OCR software, a lower cost.
When the cost of high precision and accuracy becomes prohibitive, data intended to expand government transparency becomes of limited value. Data quality is the suitability of data for a purpose taking into account the cost of obtaining acceptable levels of precision and accuracy.
3. Case Studies
The case studies in this chapter compare the principles of open government data to instances of government data dissemination.
1. House Disbursements
When the U.S. House of Representatives began publishing its disbursements (operational spending) records online in 2009, I evaluated the quality of the data release according to the principles of open government data discussed earlier. Disbursements include how much congressmen and their staffs are paid, what kinds of expenses they have, and who they are paying for those services. The disbursements release makes a great case study in how to do data transparency.
Uses of House Disbursement Records
In evaluating the quality of the data, I looked to the subsequent uses of the data to understand its purpose. After all, it is impossible to evaluate data quality in the absence of a purpose. Sunlight Foundation’s Daniel Schuman has investigated a very serious question: “whether Congress has the support necessary to do its job.” Based on the disbursement data plus historical records, Schuman found that the number of congressional staff has decreased 13 percent since 1979, and in particular congressional committee staff, which do most of the policy work, has decreased 37 percent in the same time. Most Hill staff salaries have remained the same over the last two decades (accounting for inflation), and with equivalent private sector jobs often paying more it is no surprise that Congressional staff will often leave for private sector jobs. This paves the way of the revolving door, in which former staff make use of their contacts to advance the agenda of their new employer.164 In a later analysis from the Sunlight Foundation, Lee Drutman compared the disbursement data with registered lobbyist data to approximate the magnitude of this revolving door.165 Putting aside whether the revolving door may be inappropriate or illegal, it indicates a clear problem of unequal access to policymaking.
I had run several statistical regression analyses on the disbursement data and found that offices spent more on some staff positions for each year the congressman was in office — $2,500 more on staff assistants each year — but not on others — such as legislative correspondents and chiefs of staff. This might mean that congressmen make sure they are on an equal footing by all hiring from the same pool of experienced candidates, and also that chiefs of staffs don’t consider it a perk (i.e. willing to take a pay cut) or a detriment (i.e. wanting more pay) to work for new or older congressmen either. Also reported in the dataset is the yearly expense on franked mail. This interestingly decreased by $1,300 per year in office, suggesting that greener congressmen rely more on franked mail for public relations than more senior congressmen who might have access to other methods of public relations such as coverage in the press.166
A third use of the data is by Legistorm.com, which is a database of congressional staff and salaries and is often used by lobbyists and other outsiders to locate potential points of contact within the Hill. Helping lobbyists was surely not an intended use of the data. The data was released for the purposes of disclosure and should be evaluated first on how well it lets the public root out inappropriate spending, second on how well it helps the public understand trends in spending, and third on unexpected uses such as Legistorm’s use of the data.
Evaluating The Data Release
The first thing the release did right was put the data online (currently at disbursements.house.gov), free of charge. The downloads of current information and archived releases are clear links at semi-permanent locations. The data format (PDF) is an open non-proprietary standard, and the data is released in bulk because each release is provided as a single file download. The release is provided on a non-discriminatory basis (i.e. no registration requirement), and use is not restricted by any license terms or by law. Furthermore, the PDF files are digitally signed by the Government Printing Office which establishes their provenance. The data is also released on a relatively timely basis. The website indicates the statements are published within 60 days of the end of the quarter, and the most recent disclosure at the time of writing seems to have been published as quickly as 11 days after the end of the previous quarter. There were also no technological choices that could be construed as an endorsement.
One of the more exemplary aspects of the data release was its documentation, which included an explanation of the reporting process, a FAQ, a glossary, and a table of transaction codes found in the document, all crucial for anyone reading or analyzing the information. This was one of the best examples of documentation I’ve seen for government data of this kind.
The data release comprises information that is as dis-aggregate as is reasonably possible (i.e. it is primary). The disclosure comprises essentially quarterly totals of line items. Because the documentation actually described how the House Clerk receives the information, and explains some degree of aggregation taking place such as a $10,000 travel record not necessarily being for one trip, we know that the data release process involved relatively little aggregation. Given the emphasis in the actual use of the data on analysis of historical trends over decades, rather than on real-time watchdogging, more precise line items and more timely release do not seem to be necessary.
The disbursement records satisfied 10 of the 17 principles of open government data (some of which were not known as principles at the time the data was released), and in the cases of timeliness and documentation did so in an exemplary way.
Some of the principles that were not addressed are public input (there was no public discussion on how these files ought to have been made available), public review (there is no contact person for this data set that is made known to the public), interagency coordination (the statements might have made use of the ID scheme for Members of Congress used in other House records), the use of safe file formats (PDFs may contain macros), and the recommended prioritization of data.
Two principles remain: machine processability and whether the data promotes analysis and reuse. In order to evaluate whether the disbursement statements were machine processable, one must look at the precision, accuracy, and cost of extracting the disbursement numbers out of the released PDF. The PDF contains rows of disbursements in the form of a recipient (a person or vendor, such as a telecommunications provider), a dollar amount, and various transaction codes, separated by category and in sections by congressional office. However, a PDF of tabular information provides no mechanism to search, sort, or sum. It must be converted into a spreadsheet before any analysis can be performed. PDFs vary, depending on how they were created, in the ease of extracting data out of them.
Taking the third-quarter 2009 release (the first release) as an example, copy-and-pasting a 3,397 page document into a spreadsheet program such as Microsoft Excel would have been cumbersome, and in fact would have produced garbled columns and rows in Excel. The best way to extract the information into a tabular format was an obscure use of a Unix command-line PDF processing tool,167 and while the resulting spreadsheet looked good, there was no way without reviewing 3,397 pages of numbers to actually know how accurate the conversion process was. Low accuracy would have been a problem, but not knowing the level of accuracy and not knowing what sorts of errors might occur is also a serious problem.
For instance, it took some insight to head off assigning disbursements to the wrong congressman. Eric Mill, a developer at Sunlight, wrote at the time, “There is no unique identifier in the data, and no standard way of formatting names of House members. Some use their nickname, some their formal name, some last names are hyphenated that shouldn’t be, other last names should be hyphenated but aren’t, etc. There are even two representatives named ‘Mike Rogers’ serving(!), and there is absolutely no way of telling the difference between the [expenditures of the] two.”168 This is a quite low level of accuracy.
As for precision, the variation in the naming of recipients of spending, and, additionally, the occurrences of recipients with the same name, prevent the reliable aggregation of spending by recipient. For instance, AT&T was listed under at least three names and there were 27 different names for units of Verizon. Without the ability to reliably identify which individuals are the same and which are different, it is difficult to know whether any particular line item is an abberation, and it is impossible to be confident about whether any recipient aggregate is correct. The precision of other aspects of the data, such as office and spending categories, was sufficient to make the sorts of generalizations described earlier. But the value of the remainder of the data is substantially lower because of the lack of precision and accuracy.
When I say low precision and accuracy I mean at a reasonable cost to someone performing oversight of House spending. At cost of say $10,000, the PDF could have of course been transcribed by hand into a spreadsheet for the highest conversion accuracy, and interns could have been sent out to research the information to add precision. Not only is the cost prohibitive to anyone who might be interested in government oversight, at that rate the PDF itself becomes moot because for the same effort the same could have been done with the printed bound volumes that have been available to the public for decades. In other words, formatting of the data is key to achieving useful machine processability.
Considering the size of this data set, the ability for computers to process this information without human intervention is a critical part of its value for analysis. The data as released only nominally meet a reasonable standard of precision and accuracy within a reasonable cost. PDF is the wrong format for tabular data. A spreadsheet (whether as a plain CSV file or any other open format) would have been far preferable as it would have maintained the accuracy already present in the House Clerk’s own data files. What a PDF is good at preserving accurately is font and pagination, two aspects of House disbursements of the absolute least value. Besides the use of a spreadsheet format, the use of unique identifiers for Members of Congress and spending recipients would have dramatically improved the dataset’s quality.
6. Paradoxes in Open Government
In The Matrix, Keanu Reeves’ character faces an early choice. If he swallows the red pill, he would become Neo and see the troubled world for what it really is. But if he takes the blue pill, he would return to a life of ignorant bliss as Mr. Thomas Anderson. At first his decision to see the harsh reality is celebrated by the audience. And yet by the end of the trilogy we’ve learned that the choice was a set-up all along orchestrated by the machine in control of the universe. Knowledge has unexpected consequences. (Belated spoiler alert.)
The type of government data I’ve discussed throughout this book isn’t dangerous in the way that military secrets or private, personal information could cause physical harm to individuals. But it is the type of information that can lead to widespread systematic changes. Teaching the public how government works, uncovering corruption, and promoting policy changes such as public financing of elections can lead to broad changes that affect many aspects our society.
The first part of this chapter could be called the Heisenberg Uncertainty Principle of Transparency. Observations can alter and even cast a shadow on the very events we are trying to shed light on. Politicians may alter their behavior to game the statistics computed by transparency advocates and journalists. And when we enhance disclosure laws, they will take their encounters with lobbyists into less formal environments. These aren’t obstacles that can be overcome by regulation. That’s why I call them a paradox. As soon as new transparency rules are enacted, the events they meant to uncover are no longer visible to that spotlight. Transparency in some cases is impossible, and in rare cases can even be detrimental.
The second part of this chapter considers the danger of treating government transparency as merely publishing facts. It is all too easy to pretend things are just as they seem. Governments are incredibly complex systems made up of highly strategic policymakers. Government transparency advocates need to consider the existing system in a thoughtful way before stigmatizing crucial parts of the way government functions.
1. Unintended Consequences and the Limits of Transparency
The Bhoomi program and digital divides
There is plenty of evidence both academic and anecdotal that government information can promote a good government. Each scandalous resignation is a testament to the speed with which information in the hands of the public can enforce accountability. But government transparency programs can also have unintended consequences.
Michael Gurstein wrote in a blog post169 about the difference between opportunity and the ramifications of the actual uses of open government data. Gurstein pointed out that not all data yields an “effective use” of the data, and that is especially the case when not all individuals have an equal opportunity.
One studied case was the 2001 digitization of land ownership records in the south Indian state of Karnataka. The digitization project was called the Bhoomi program. The purpose of the program was to improve efficiency and thus facilitate trade and investment. It was also intended to reduce bribery, for instance, by using software to enforce first-come-first-served policies. But what was the result?
On the one hand, a large database of land titles, soil type, and crop use patterns was created. The records became an important part of how landowners could obtain loans and how farmers would buy seeds and fertilizer. This probably means the information made these markets more efficient. On the other hand, access to electronic records was slower than access to physical records on account of computer malfunction and power outages. Bribery reportedly increased because the number of administrators in the Bhoomi system was much greater than in the previous system (consider all of the new IT infrastructure). New conceptual complexities in the Bhoomi system put poorer individuals at a disadvantage, since they could less afford expediters that understand the system. And by shoe-horning complex legal situations into simplified computer forms, uncommon situations often encountered by the poor were marginalized out of existence. A 2007 report on the subject summarized the consequences of the Bhoomi program:
The main findings, at two levels, contrast conventional wisdom. First the digitization of land records led to increased corruption, much more bribes and substantially increased time taken for land transactions. At another level, it facilitated very large players in the land markets to capture vast quantities of land at a time when Bangalore experiences a boom in the land market.170
While bribery and electrical power losses are not much of an issue in the United States, the question of equal opportunity is still relevant. Gurstein later called attention to the 70% of individuals world-wide who do not have Internet access, the 80% who do not own a computer, and the 25% who are illiterate, all of whom could not access open government data and open government websites. The result is that new online tools for government accountability are “simply a means to further enable/empower those already well provided by society with the means to influence government,” he wrote.171
Clay Shirky has given equal opportunity an interesting twist. Typically, equal opportunity is based on something we think is out of the control of the individual: money, race, disability, social connections. That gives equal opportunity a moral grounding. But Shirky wrote, “If transparency lets all interest groups make use of improved information, then we would expect that the better organized interests to make better use of any new transparency.” In other words, we need to be careful not only of imbalances of accessibility to the information itself but also to imbalances in social infrastructure and political climate that affect collective action. “This is not to say that transparency is never good; it is to say that it isn’t always good, and that the negative effects result from imbalances in the will to collective action, not just access to information,” Shirky wrote.172
Dana Boyd and Kate Crawford (2011)173 warn of new digital divides. When Big Data is housed in private databases, only those with the financial means to buy access — i.e. top-tier universities — will be able to study it. And of course raw data is not something everyone can use. “Wrangling APIs, scraping and analyzing big swathes of data is a skill set generally restricted to those with a computational background,” they wrote. For Boyd and Crawford, Big Data primarily benefits the elite.
But a digital divide is no reason not to publish open government data, for the same reason that illiteracy is not a reason not to publish books. Books have been a boon for everyone, even if not everyone can read them. And the fact that not everyone can fly to D.C. to attend a presidential press conference doesn’t mean journalists should not cover the White House. Direct access by some, especially journalists, is the first step to indirect access for many more.
What made the Bhoomi program so susceptible to bribery was that it was a government service more than it was a publication of open government data: Land titles need frequent correcting and updating, and it is through the interaction with government officials that bribes arose. And it seems that at least part of the reason why Bhoomi records were so useful to those with relative power was because of the new complexities of the larger system in which the records themselves were just a part. The imbalance of opportunity was created in the land management policy at least as much as it was created in the digitization itself.
And even with a digital divide, the most important uses of government data are performed by mediators — especially including journalists — who can create off-line consequences of on-line data. Traditional newspapers do this directly simply by printing their stories off their computers. But all forms of mediation, even websites, can raise an issue into social awareness beyond the confines of those who might have accessed the original bytes. That’s not to say that open government data can’t have unintended consequences, just that unequal access to the actual data isn’t likely to be a cause of it.
What is likely to cause unintended consequences is when data is of unequal relevance to different sectors of the public. Although data from the Securities and Exchange Commission has some role to play in smoothing out the entire economy, which is good for everyone, it clearly has only direct relevance to investors, and more so to the higher-stakes investors.
Instead, the important questions are what data is made open and who is likely to take advantage of it, and how the data is made open so that it can be transformed into civic capital.
The Wonderlich Transparency Paradox
Transparency can have an effect on the accountability of government representatives through different channels. Malesky, Schuler, and Tran (2011) distinguish incentives, “the notion that increased openness forces delegates to perform better in order to win over voters in an electoral democracy”, from selection “which is that increased transparency enables voters to choose better candidates for office.”174 But they demonstrated that incentives can have a perverse effect on policymaking when the public misunderstands the policymaking process — or at least when the politician fears he will be misunderstood.
Malesky, Schuler, and Tran conducted a rare experiment by actually influencing ongoing politics in Vietnam. In collaboration with VietnamNet, the leading online newspaper in the country, they launched a column that highlighted the political activities of 144 randomly selected delegates of the 493-member Vietnamese National Assembly in 2010. The column posted photos, news articles, interviews, and resumes of those delegates as well as daily performance metrics based on the delegates’ participation in their query session — similar to the British parliament’s question time. Those metrics were:
(i) The total number of the speeches and queries that the delegate made; (ii) The number of speeches and queries by the delegate that were critical of the government policies; (iii) The number of the speeches and queries by the delegate that were relevant to the interests of delegate’s constituents, province, and profession; and (iv) Comparison of the delegate’ [sic] performance in the above indicators with the best, average and worse delegates.175
The expected outcome of this experiment was not particularly clear. As a single-party state, Vietnam’s politicians are relatively shielded from whether their constituents approve of them or not: “The enormous power of provincial election boards in determining the level of opportunity available for a candidate calls into question the level of responsiveness of a particular delegate to underlying voters”.176 (In fact, delegates are so shielded that their voting records are not made public.) If it’s true that constituents do not have much of a role to play in elections, then there would be no incentive for politicians to alter their behavior that was exposed to their nominal constituents. And, at first that appeared to be so. Whether a delegate had been covered by the special VietnamNet column did not, across all delegates, affect the metrics.
But when the investigators took into account that the delegates come from provinces of varying levels of Internet access, a different picture emerged. The delegates who were covered by VietnamNet representing provinces with the highest Internet penetration “ask a full question less and reduce their criticism more than 12%” compared to delegates in digitally-similar provinces that were not covered by VietnamNet. It seems then that even in an authoritarian state public opinion matters, and transparency leads delegates to be more conformist to avoid public scrutiny. If this in turn leads to fewer important issues being discussed by the National Assembly, then transparency resulted in a net loss for making good public policy.
But transparency can have the opposite, yet perhaps equally detrimental, effect. A 2006 article in the Times of London claimed that British MPs had been participating in more debates and offering more questions for question time in an attempt to influence the metrics of one of the leading government transparency websites there, TheyWorkForYou.com, a project of mySociety. “A senior Commons official told The Times,” the article reported, “ ‘Every time you intervene they would count you down as if it was a speech, even in Westminster Hall, where there are five debates a day and virtually any debate you can get in on. A few Members have grasped this.’ ”177 The change in the behavior of the MPs wasn’t to be better policy makers: it was to appear to look more active through making the least amount of effort. Contributing a single word to a debate may be more of a distraction than anything else, and so just as fewer questions can be bad for public policy so, too, could be more but irrelevant questions.
Politicians are smart. They will use the tools available to them to elevate their profile and push their message. Shortly after the Sunlight Foundation launched Politwoops (politwoops.sunlightfoundation.com), a database of deleted Tweets178, Montana representative @DennyRehberg started tweeting and promptly deleting his tweets with the apparent intention to have his tweets appear on Politwoops. In a retweet-and-delete, Rehberg tried to be funny:
RT @SpeakerBoehner You know what else has been deleted? Jobs in the Obama economy. Where are the jobs? #politwoops via @SunFoundation179
It is difficult to judge whether these unexpected effects were good or bad. It’s possible the Vietnamese delegates distilled their list of questions to the most pertinent ones to their constituency, resulting in better use of their question time, rather than culling their questions to be more conformist. Why British MPs would speak more and Vietnamese delegates less under similar conditions of scrutiny has yet to be answered, but either way there are unintended, and perhaps unwanted, consequences of parliamentary transparency.
But it is normally the case that the more we can see of policymakers, the more the policymakers want to take their negotiations somewhere else private. And by no means is that even necessarily a bad thing for reaching good policy outcomes. Sometimes the ability to have frank discussion in private is useful. The most revered of all meetings of politicians here, the U.S. Constitutional Convention in 1787, was held in strict secrecy. James Madison reflected later that “no Constitution would ever have been adopted by the convention if the debates had been public.” And if that’s true, it is still true even if the delegates’ motivations for secrecy were less than pure. Madison surely knew that his Virginia Plan for a strong national government would have faced passionate opposition from his contemporaries still reeling with anti-monarchy bitterness, including Sam Adams and Patrick Henry. No doubt he knew secrecy at the convention gave his plan a better chance of success. And since his vision ultimately became the framework for the Constitution, anyone would have to admit that the end result of secrecy was soundly a success. Thomas Jefferson, learning of the secrecy rule at the convention while in Paris, called the secrecy “abominable.” One should wonder whether he would still think so in hindsight.180
Antiquated transparency laws today are actually hindering transparency and innovation. State open meetings laws are preventing local officials from engaging citizens online for fear of inadvertently having what would be legally considered a meeting that would not meet other requirements such as public notice and public access.181 At the federal level, the 1972 Federal Advisory Committee Act is preventing the exchange of knowledge between the government and private sector. The purpose of the law was to prevent federal agencies from having back-room consultations with corporate executives and other entrenched sources, but the requirements for obtaining public input have grown so complex under the act that today the law is probably preventing federal agencies from getting the best knowledge.
Secrecy is a dynamic process responding to structurally imposed transparency. The New York Times reported that after a new 2008 ethics law imposed stricter lobbying reporting requirements, the number of registered lobbyists started to dramatically decline.182 Referring to the Honest Leadership and Open Government Act, P.L. 110-81, the article’s headline “Law to Curb Lobbying Sends It Underground” was a little dramatic. Not all of the lobbyists who de-registered did so with the intention to violate the law — some decided that the requirements outweighed the need to lobby at all, especially when their lobbying duties could be transferred to another registered lobbyist in their organization. But, still, anyone involved in policymaking would prefer to not have to play their hand in the open. That’s how negotiating works, and no doubt many lobbyists who de-registered did so legally but strategically by reducing the amount of time they spent lobbying to fall under the minimum requirements.
Similar effects happen with other sorts of rules. The New York Times reported in 2009 on the effects of a ban on trips by Members of Congress financed by lobbyists. The ban successfully cut the number of such trips in half or more, but violations continued and loopholes were exploited. The article gave fascinating details of the Congressional Black Caucus’s retreat at a casino resort in 2008:
Each of the 14 House members submitted a detailed agenda for approval to the ethics committee. It listed social events like a golf outing, but it also included serious topics like health care and global warming. But there is something missing from the agenda sent to the ethics committee.
A different copy handed out to the caucus members is much the same — except for the line under each event that names a corporate sponsor. A workshop focused on health care included the words ‘Sponsored by Eli Lily,’ the big drug company with a huge stake in health care legislation. Edison Electric Institute, an association of power plant owners, hosted the global warming seminar. Wal-Mart sponsored a clinic to teach lawmakers and other attendees how to skeet shoot; after the lessons came a competition sponsored by the International Longshoremen’s Association.
William A. Kirk, the Washington lawyer and lobbyist who helped arrange the weekend, said the sponsor companies did not directly pay for the events or member travel. They became sponsors by contributing to the general fund of the caucus’s Political Education and Leadership Institute, which is a nonprofit. Money from the general fund, however, paid for hotels and other accommodations. Members were responsible for their own flights, though some used campaign funds.183
Is this bribery? It is without a doubt inappropriate. But lawmakers will be lawmakers so long as they continue to have the same incentives. A travel ban does not pay for a Caucus retreat. It might make some think twice before violating the rule, but others will take their chances, perhaps rationalizing their actions, and accept inappropriate funding anyway.
It is impossible to shine a light and actually see everything that is there. Each new spotlight changes the game and sends some activities scurrying away beyond the light’s reach — a little like cat and mouse. But there’s so much cat and mouse all the time that you have to wonder whether anything truly ever changes. That’s captured well in what has been called (by a few) the Wonderlich Transparency Paradox, named after John Wonderlich at the Sunlight Foundation. It is one of those terms that is bound to make the textbooks one day. Anyway, Wonderlich once wrote, “How ever far back in the process you require public scrutiny, the real negotiations . . . will continue fervently to exactly that point.”184 Or, to paraphrase, no matter how much transparency you put into the system, the real work is always going to happen just off stage.
A paradox is something you cannot avoid. It is impossible to require truly public debate. Even 24/7 filming of politicians’ lives won’t create transparent decision-making. The stars of reality shows already know how to get around film crews: by mixing in explicit content the film crews won’t air. There are other techniques. A negotiation in plain sight is meaningless if those watching don’t know when to watch, or can’t understand the terminology, or are overloaded with too much information to process. And if transparency regulations make the lives of politicians so onerous, we should start asking whether it impedes their ability to do their job or even affects what sorts of people would be willing to put up with the burden (in the case of 24/7 transparency, more exhibitionists would run for office). Transparency is not something that can always be legislated, and in certain cases, like the Constitutional Convention, not something we should always want.
2. Looking for Corruption in All the Wrong Places
The public view is a stage
Politicians and policymakers know the game as well as the journalists and transparency advocates. When decision makers want privacy, they can take the real conversations into a coffee shop and only pretend to debate at the legally proscribed time. And they know equally well that they hold all of the cards when it comes to access to information. When journalists and transparency advocates regurgitate the conveniently observable facts without analysis transparency can do more damage than good.
Some facts are not the truth. In her classic piece “Insider Baseball” in The New York Review of Books, Joan Didion described a perverse sequence of events in which political reality was manufactured. On a hot day in 1988, presidential candidate Michael Dukakis stepped off an airplane and had a short baseball toss with his press secretary. The ball toss was reported in U.S. News & World Report, The Washington Post, and elsewhere. It became a part of the criteria on which the public was choosing their president. But in a sense that ball toss never occurred.
A ball was thrown, but Dukakis was interested in neither sport nor exercise. It was staged. It was not just staged, but it was a re-staging of a previous ball toss that had not been captured well by the media. And the reporters probably knew it. Didion wrote,
What we had in the tarmac arrival with ball tossing, then, was an understanding: a repeated moment witnessed by many people, all of whom believed it to be a setup and yet most of whom believed that only an outsider, only someone too “naive” to know the rules of the game, would so describe it. . . . [T]his eerily contrived moment on the tarmac at San Diego could become, at least provisionally, history.’185
A staging that probably everyone knew was a staging became a ball toss. The public was told a reality that was no more real than today’s reality TV. And perhaps the course of history was changed.
This happens regularly. Just last year, the public’s view of the national debt negotiations was a mix of the fables told by the politicians involved. Reflecting on the events six months later for The New York Times, Matt Bai wrote,
Almost immediately after the so-called grand bargain between President Obama and the Republican speaker of the house, John Boehner, unraveled last July, the two sides quickly settled into dueling, self-serving narratives of what transpired behind closed doors. A few [sources] mentioned, independently of one another, that the entire affair reminded them of “Rashomon,” the classic Kurosawa film in which four characters filter the same murder plot through their different perspectives. Over time, the whole debacle became the perfect metaphor for a city in which the two parties seem more and more to occupy not just opposing places on the political spectrum, but distinct realities altogether.186
Because the negotiations were private the only information reporters had to go on at the time was the stories told to them by the politicians who were involved. Boehner asked for too much. Obama moved the goal post. Those stories were repeated countless times. Journalism is not the same as repeating someone else’s fable.
The paradox to be learned from the ball toss and the debt deal is that facts are sometimes wrong. Facts have to be understood within the systems in which they were produced. Reporters must understand that campaigns stage events and that politicians spin. And facts must be presented in a context that tells the right story.
Systemic corruption?
In the United States we are pretty lucky. For all our transparency woes, bribery is practically nonexistent compared to elsewhere in the world, and our government is digital enough that we can access many of the laws that govern us and how they were decided from our computer. Unfortunately, the flip side is that the corruption that we do have is so much harder to see. The nefarious politicians and lobbyists usually know enough not to make transactions that they will have to report. Gifts, travel, assets, and campaign contributions are highly regulated and scrutinized through disclosure laws and in some cases complete bans. Now that it takes so much effort — real, hard enterprising journalism — to find corruption, we should be suspicious of claims that corruption is everywhere.
For instance, OpenCongress.org — which is largely a clone of my website GovTrack.us — paints a dark picture of a “broken and systemically corrupt system of captured government,” by which they mean that government decisions are based largely on how they would affect the profits of corporate executives.187 MAPLight.org talks up a similar angle: “Elected officials collect large sums of money to run their campaigns, and they often pay back campaign contributors with special access and favorable laws. This common practice is contrary to the public interest, yet legal,” they wrote on their About page.188
The concept of systemic corruption was popularized by lawyer-professor Lawrence Lessig in 2008 with his Change Congress project (later renamed Fix Congress First and now Rootstrikers). To Lessig, Congress is corrupt in so far as money plays an intrinsic role in who gets elected and how they make decisions after taking office. Lessig, like Louis Brandeis (see section 3.1), is concerned about conflicts of interest. Lessig says lobbying is “pervasive and corrupting” and that Members of Congress have a “dependency on the funders.” The corruption is “nothing so crude” as quid pro quo, he says, meaning the problem is not as simple as bribery.189
Systemic corruption of this sort might be said to come in three parts. First, it takes money to get elected to Congress, and a lot of it. That creates a selection bias in the sort of individuals who can become policymakers. Second, once in office, decisions may be influenced by campaign contributions from past elections or the prospects of campaign contributions for future elections. Third, and most insidious, is that policymakers may get a skewed perspective of reality by spending disproportionate time with those with the ability to pay for access (see Sunlight Foundation’s Party Time website described in section 3.1). This is all true, but not everything in government is corrupt.
There is a lot of rhetoric on the subject of systemic corruption, like this sentence from the description of a conference hosted by Lessig’s Fix Congress First organization:
From the Right and the Left, citizens are increasingly coming to recognize that our Republic does not work as our Framers intended.190
This is spin. Our Republic didn’t work the way our Framers intended even during the time when the Framers were still running it. The partisan politics George Washington famously warned of in his Farewell Address fully materialized between the time of his Address and the actual end of his presidency. The sentence I quoted is intended to rile people around the idea of making government better. But it does so at the great expense of misleading the public that government has gotten worse. That couldn’t be farther from the truth.
In regular press releases and blog posts, MAPLight.org highlights the correlation between campaign contributions and how Members of Congress vote (MAP stands for “Money and Politics”). I first met MAPLight’s co-founder and executive director Dan Newman back at the 2005 Personal Democracy Forum as he was shifting the site from a focus on California legislation, as TakeBackCA.org, to a focus on federal legislation. Today the site is tracking money and votes in Wisconsin and Los Angeles as well California and the U.S. Congress. MAPLight combines data from the Center for Responsive Politics’ OpenSecrets.org, my own GovTrack.us, and MAPLight’s own research for its analyses of U.S. legislation.
In a May 17, 2011 blog post the site reported that
Major (multinational) oil & gas producers gave 8.8 times as much to senators that voted NO as they gave to senators that voted YES [on a bill, S. 940, that would raise taxes on the oil producers]. . . . Interest groups that supported this motion (Democratic/Liberal and Environmental policy) gave 20 times as much to senators that voted YES as they gave to senators that voted NO.191
MAPLight has found this pattern dozens if not hundreds of times. And yet it’s not at all clear what it means. Is this evidence of systemic corruption?
While MAPLight doesn’t say that the correlations they find are also evidence of causation, they must believe that the numbers are indicative of some causal relationship — otherwise their analysis would have no bearing on the reality of “special access and favorable laws” that motivated the site’s creation in the first place. In other words, without some complex chain of events linking the campaign contribution to the roll call vote it would be just coincidence. It’s not a coincidence. But we need to understand that chain of events before jumping to any conclusion.
Failing to understand the chain of events would be like denouncing Hallmark’s cyclic advertising campaigns as the source of all unpleasant wintry weather. Not only were the votes on S. 940 correlated with money raised, but with the senators’ net worths, ages, and a host of other factors. Interest groups supporting the bill gave 50% more to the 50 senators serving from the states at the end of the alphabet, compared to the 50 serving from the first half of the alphabet!
And then there is party. Votes are almost always split closely along party lines.192 A donation to a yes-vote and a donation to a Democrat look the same in aggregate for S. 940 — the yes-votes are by and large the Democrats. If MAPLight had reported that “Democratic/Liberal and Environmental policy” interest groups gave 100 times more to Democrats than Republicans and “Major (multinational) oil & gas producers” gave five times more to Republicans than to Democrats, we’d be much less suspicious of corruption. There’s nothing surprising about interest groups being aligned with parties (especially “Democratic/Liberal” interest groups being aligned with Democrats). The individuals making up the contributors in those interest groups of course supported candidates with similar views to their own! And since party whips keep their members in line, the fact that there is also a correlation to votes is hardly cause for alarm.
If money is primarily what determined the outcome of the vote on S. 940, and not the senators’ actual views or their party affiliation, then we should expect money to explain why five senators broke with their party in the vote. Sen. Susan Collins, a Republican who voted for the bill, actually received twice as much money from opposing interest groups than supporting interest groups. In fact, all five of the senators that broke from their party also broke from the side that gave them more cash.
It’s easy to paraphrase the corruption right out of MAPLight’s analysis. Left-leaning groups gave to Democrats and right-leaning groups gave to Republicans. In the few cases where senators broke with their party, it was against the position of their funders. MAPLight’s numbers aren’t wrong. Facts are facts. But the facts say nothing about corruption, which is sad because there are real conflicts of interest that need to be addressed.
* * *
Comparing voting records with campaign contributions is easy thanks to two and a half centuries of progress in the freedom of information movement. We have to make the comparison to check up on our Members of Congress. But just because a correlation is true does not make it relevant. Lawrence Lessig wrote the following in a 2009 article “Against Transparency”:
At this time the judgment that Washington is all about money is so wide and so deep that among all the possible reasons to explain something puzzling, money is the first, and most likely the last, explanation that will be given. . . . But what about when the claims are neither true nor false? Or worse, when the claims actually require more than the 140 characters in a tweet?
This is the problem of attention-span. To understand something–an essay, an argument, a proof of innocence– requires a certain amount of attention. But on many issues, the average, or even rational, amount of attention given to understand many of these correlations, and their defamatory implications, is almost always less than the amount of time required. The result is a systemic misunderstanding — at least if the story is reported in a context, or in a manner, that does not neutralize such misunderstanding.193
This is the same Lessig who sits on MAPLight’s board of directors, and who calls Congress corrupt for allowing elections to continue to be funded by individual contributions. But I think his point here is correct, that the nuanced analysis needed to actually prove corruption is missing from the picture so often portrayed to the public, leaving the public lost in a forest of cynicism.
From academic research we know that the relationship between money and roll call votes shows no evidence of widespread corruption, and mixed evidence of any causal influence at all. Thomas Stratmann summarized in a 2005 article:
Recent research shows that campaign contributions have not had much of an effect on legislative voting behavior . . . Bronars and Lott (1997) examine whether retiring legislators, who are not threatened by retaliation in the next election cycle, change their voting behavior, measured as a change in voting score, when there is a change in contributions from relevant PACs. They find only modest evidence that changes in these contributions change voting behavior. Ansolabehere, de Figuieredo and Snyder (2003) examine the effect of labor and corporate contributions on voting scores assigned by the US Chamber of Commerce and likewise find no evidence that contributions affect voting in the predicted directions once one allows for member or district fixed effects, or uses instrumental variables estimation.194
Looking across 265 separate studies on the subject, Stratmann found a causal relationship between campaign contributions and roll call votes that was so small that he was not sure it was even real.195
The National Institute on Money in State Politics found in 2009 “little influence of campaign contributions on stimulus contracts.” The organization compared government contracts awarded under the American Recovery and Reinvestment Act against its database of donors to state-level political campaigns and found only 3.2 percent of contract recipients had been donors. Without some sort of baseline it is hard to know whether 3.2 is a lot or a little, but it seems like a little. Although one might say those 322 contractors made a 300-times return on investment, there’s no way to know whether their $35 million in total contributions had anything to do with their contract award, and the other 96.8 percent of awardees didn’t appear to get the award through this sort of conflict of interest.196
The Center for Responsive Politics (CRP) found in 2010 that a quarter of General Motors’ contributions to congressional campaigns went to Members of Congress that had voted against GM’s bail-out during the economic crisis. CRP wrote on its OpenSecrets blog that this was ironic, as if the only way this could have happened was if GM’s PAC (political action committee) fell asleep at the wheel — not that there could be reasons for campaign contributions besides quid pro quo.197
CRP later reported that while postal union PACs and employees contributed $44,000 to Rep. Darrell Issa’s 2010 election war chest, he introduced a bill “ending Saturday delivery, closing post offices and laying off workers.” The postal union explained their reaction to the CRP blogger:
“We supported Issa pretty early on last cycle, and that was a direct result of him reaching out and working with us,” Jennifer Warburton, director of legislative and political affairs for the National Association of Letter Carriers, told OpenSecrets Blog. “He said there had to be a way to reform the Postal Service to keep the dignity of postal workers intact.”
“We had thought he was going to be a strong leader in the House, and we were hoping that we’d be able to work together,” [Mark Strong, president of the League of Postmasters] told OpenSecrets Blog. “It’s quite evident that won’t happen, and he won’t be getting our support in the future.”198
Issa was not bound either by money or by implied commitments to policy decisions. And the same went for those Members of Congress taking campaign contributions from GM.
So, yes, money poses a moral dilemma for policymaking. To be sure, there’s no question that some individual lobbyists and congressmen intentionally create conflicts of interest and conduct successful bribery. There is some evidence that campaign contributions influence other aspects of policymaking, such as what amendments are offered during the committee process.199 And without a doubt, only candidates with the right charisma and connections can raise enough money to unseat an incumbent. Public trust in Congress is also especially low, and voters are becoming more savvy about the connection between money and policy. But the rhetoric makes it sound as if every campaign contribution, or, worse, every act of every politician and lobbyist, is inherently corrupt and directly resulting in bad policy.
But is that what is really happening? Lessig himself consistently hedges that even if systemic corruption is not as great as he thinks, most Americans still believe that money buys results and that the “profound lack of trust” is enough to warrant reform.200 In his article Against Transparency, Lessig wrote that Big Data hasn’t yet proved widespread corruption: “The most we could say—though this is still a very significant thing to say—is that the contributions are corrupting the reputation of Congress.”201 The main proponent of the idea of systemic corruption is not sure if it is true.
* * *
It’s strange that campaign contributions are so stigmatized when millions of individuals contributed to a presidential campaign in 2004202, presumably because they believed that if their candidate won then things would be better for them. It is unfortunate that campaigns need so much money to be competitive in buying advertisements, holding events, polling, paying staff, and, confusingly, funding other less-endowed campaigns (more on that later). But it is individuals who drive large campaign spending, and individuals choose who to donate to in part based on the past actions of those candidates, including how they’ve voted on policy issues. It’s no surprise that the politicians I contribute to have political views correlated with my own. There is nothing nefarious there.
Granted, there are morally confusing forms of contributions. An individual may contribute a particularly large amount, or he may strongly urge his employees to contribute through a company PAC, or he may “bundle” the contributions of others so they appear as a bloc and then expects to be remembered for it. These create conflicts of interest. Bundling was more common until the 2007 law that required lobbyists and others to disclose their role in bundled contributions. In a 2009 disclosure form, Rep. Peter King from New York reported that $51,750 in contributions were bundled by former New York City mayor, former presidential candidate, and possible future candidate Rudy Giuliani. That’s 20 times what Giuliani could legally have contributed personally, and no doubt King will remember him for it. Senate Majority Leader Harry Reid reported $18,700 in contributions bundled by Tony Podesta, one of the most influential lobbyists.203 That is quite a conflict of interest for Podesta to bring Reid both cash and requests from the organizations he represents.
Then there is the stigma of the lobbyist. A lobbyist is someone who advocates a position before the government. If there were no lobbyists government wouldn’t know what laws to make. And while some lobbyists work for corporations, many others work for non-profit organizations. What gives lobbyists their power is not their money, at least not directly, but rather their wonkish knowledge of the legislative process.
“[T]he day-to-day of the lobbyist is really not all that glamorous,” wrote Lee Drutman in his doctoral dissertation:
It is staying up on the very latest news, knowing what’s moving, what isn’t, why, and what to do about it. . . . [T]his banality of lobbying may be precisely the reason that lobbying is influential. The devil lies in the details, and only those with the resources and patience to painstakingly master the most abstruse intricacies, to cover all angles and shore up all the bases, will win. (p. 7)
Lobbyists provide issue and legislative expertise both to the companies that hire them and to the congressional staff they interface with. And yet it’s the lobbyist’s unique expertise that gives them the ability to create conflicts of interest through their role as gate-keepers. One lobbyist recalled being asked for help by a company:
“Can you get me in to see the [agency] director who is holding the public meeting, and if you get me in there, would he know you? Which inevitably means, if he knows you, I have a level of legitimacy. And also, would you help me to plan beforehand how to say the things I need to say to him in a way that’s going to make them think like us?”204
Another lobbyist explained the role of consultants:
“[W]hen I have a problem on an issue and we have to talk to a Republican Senator, he probably has 10 or 12 close friends who are Republican Senators, so I will call him and we’ll go talk to Senator X. And we have seven or eight consulting arrangements on that basis.” (p. 50)205
Like campaign contributions, lobbying is a crucial and probably necessary part of the way governance works, and yet it puts people in difficult and sometimes questionable positions.
If the campaign contribution is a lobbying tactic, as is popularly believed, it is only one of many. In a survey of lobbyists by Drutman, the importance of fundraiser events was ranked near the bottom among 21 lobbying tactics. Drutman also reported that of businesses with a lobbying presence in Washington, D.C., just 24% maintain a PAC, the sort of organization they would need to make campaign contributions.206 Of course, as Drutman pointed out, the sensitivity of admitting that fundraisers are a component of lobbying may have reduced their apparent importance. Nevertheless, it is without a doubt that the vast majority of lobbying has no connection to campaign contributions. (Because the diversity of tactics is so interesting, I have included part of Drutman’s table of lobbying tactics in Figure 24.)
Buying chairmanships
To be clear, bribery, intentionally creating a conflict of interest, and pay-for-access are all obstacles for good policy. These are real problems, and there are worse problems. By the time a bill comes up for a roll call vote the policymaking has long been over. The problem with focusing on the aggregates above — which tell us nothing about corruption — is that we miss the even more compelling stories of how money influences policy. For instance, there has been ongoing extortion between Members of Congress for the last 15 years, and it’s no secret: money buys positions on Congressional committees. Most policymaking in Congress occurs within committees, and committee chairs exercise an enormous influence over what bills are discussed and which move forward. Chairmanships are highly coveted positions.
Every two years a “steering committee” in each party’s House caucus assigns their party’s members to the House’s roughly 20 committees. When Politico reported after the 2010 elections that incoming Republican House Speaker John Boehner selected Rep. Hal Rogers to be the chairman of the Appropriations committee207, it failed to mention that Rogers transferred $456,806 from his campaign war chest to the National Republican Congressional Committee.208 The NRCC is a central pool that House Republicans disburse to Republican candidates that need some extra help getting elected to the House. Rogers transferred to other Republican candidates at least as much as he spent on his own campaign! Among the many things that worry me about this is the concern that the individuals contributing to Rogers’ campaign — or really any campaign — may not know that they are financing candidates that they have never heard of.
Rogers’ case is not at all unique. In Sharing the Wealth, Damon M. Cann documents a thorough analysis of how transfers between congressional campaigns influence assignments to chairs of House committees and to chairs of House Appropriations subcommittees. He summarized his theory of what has been happening in Congress:
[P]olitical party leaders broker exchanges with party members that are crafted to help both parties and party members reach their respective goals. [For example,] the exchange of positions of power (from party leaders) for unity in roll-call voting and financial support of party goals.209 . . .
The party’s willingness to make leadership positions conditional on member contributions offers at least a partial solution to the collective action problem the political parties face in soliciting support from their members. To the extent that party leaders control who holds positions of power in Congress (i.e. committee chairs, subcommittee chairs, and party leadership positions), they may use them as a selective incentive to encourage members to support the party and party candidates. While other potential selective incentives exist, these seem to be particularly important in encouraging members of Congress to financially support their parties.210
Cann compared seniority, party unity, contributions to other candidates’ campaigns and other factors against who won and who lost of those House members seeking chair positions. On the bright side, it hasn’t always been about money. When Republicans took the majority in the 104th Congress — following the 1994 elections — Speaker Newt Gingrich relied primarily on committee seniority when choosing his new set of committee chairs, following long-standing precedent. In other words, when a committee chair position was vacated, it would be filled by the longest-serving member of the committee (in the majority party). Campaign contributions, party unity, or even electoral safety played no appreciable role in the chair selection process. Cann noted, however, that Gingrich did not necessarily support a seniority system, but it was the way things were done at the time.
Things changed in the next two Congresses. Chair selection in the 105th and 106th Congresses (under Gingrich and then Dennis Hastert) began to be influenced by campaign contributions to the party — a tactic for party leaders to reward team players and exert control over the committees. In those years, although seniority was the primary consideration, when the Speaker stepped away from seniority it tended to be in the favor of those that contributed more to his party. An extra $30,000 could catapult the second senior Republican member into the chair.
By 2001 and the 107th Congress, the seniority system had been abandoned. By the numbers, Hastert’s chair assignments from the 107th to the 109th Congress could be explained almost entirely by who had given the most to Hastert’s party and whether they had in the past voted in unity with the party. A similar but slightly less certain picture unfolded for the selection of the chairs of the Appropriations subcommittees, so called “Cardinals of Capitol Hill.” (During this time the Republicans held the majority in the House, and the majority alone elects the committee chairs. There is every reason to believe this process continued under the Democratic majority from 2007-2011.)
If one’s ability as a fundraiser had some connection to one’s ability to run a committee, there would be no issue here. We should be concerned about this process. It sets an example for would-be chairs of what is expected of them, creating an incentive for congressmen to pay in to the party. And the candidates who receive the money from the party war chest become indebted to the party early.
And everyone becomes indebted to their donors. Now that a campaign check is routinely divided among the dozens or hundreds of campaigns of colleagues, the pressure is on to keep fund-raising well past what the candidate needs himself.
The same exchanges effect the election of party leadership. Boehner, who selected Rogers for the Appropriations chair, transferred nearly $4 million to the NRCC in the 2010 campaign cycle, the most of all Republican congressmen.211 That may have helped him in his bid for Speaker.
These are places we should be looking for corruption, all well before the moment of the vote. What guides a Member’s decision to introduce a bill on a subject? Or, going back much much further in the legislative process, what does it take to win a primary?
3. Conclusion
Even if the relationships between campaign contributions, lobbying, and votes are not as simple as some think they are, there are tangible ways money influences policy. There is a need for open government applications to investigate these influences. But I think there is a right way and a wrong way to go about it.
The surest way to bring about detrimental unintended consequences is by using regulations, fear, and shame as a tool to incite change — especially without a deep understanding of the system you are trying to change. I have been very careful leading up to this chapter to avoid examples of open government data applications that rely on negativity. I much prefer to empower the public than to shame our government. And so I put all of the bleak examples of transparency into one chapter that I hope you will just as soon forget.
So many of the examples in this book were based on the idea of empowerment. Many applications give consumers information to make better choices, from GPS signals and weather reports to the ability to find clinical trials that could improve one’s health. Other applications help consumers save time or money, such as applications around airline flight statistics and websites that display the law. Other uses of government data empower communities to make better decisions, such as where to locate new charter schools.
Recall from section 3.3 the difference in motivation between crime mapping applications that tap into fear, on the one hand, and Fruehwald’s graph of murder rates in Philadelphia which taps into humility, on the other. Or, in section 3.1, the difference between Sunlight Foundation’s charge of improper policymaking on the Amtrak privatization bill versus their Capitol Greetings project that brought congressional debate to life using art and humor. The best open government applications seek to empower consumers, to help small businesses, or to create value in some other positive, constructive way. Open government data is only a way-point on the road to improving education, improving government, and building tools to solve other real world problems.
Many of the applications discussed throughout this book were unintended consequences themselves, but of a good kind. In Chapter 1 I described the development of Federal Register 2.0, the real-time visualization of wind using weather data, and the development of the civic hacking movement, all of which no one could have predicted just a few years ago. And in Chapter 3 I surveyed how open government data is being used to improve government and policy. Campaign directors would never have thought that their fund-raising invitations would be used to educate the public about how politicians raise money from wealthy individuals and political action committees, as on Sunlight Foundation’s Party Time website. It would have been hard to predict that volunteers would help the U.S. patent office sort patent applications, but as Peer to Patent found out volunteering was a new way to impress potential employers.
Looking toward the future, I have no doubt that open government data will continue to grow and that interesting apps will be built on it. Hopefully this book has provided a useful road map of where we’ve come so far and what you could build tomorrow.
7. Example Policy Language
Defining open government data is not an easy task, both because we’re only beginning to discover the right underlying principles for an open government and also because, as noted previously, expectations differ in different parts of the world. This appendix is a collection of excerpts of open data definitions and open data policies to serve as a reference when constructing new policy language.
1. Open Government Data Definition: The 8 Principles of Open Government Data
The 8 Principles of Open Government Data were authored by a working group convened by Carl Malamud on December 8, 2007 in Sebastopol, California. The 8 Principles can be found at opengovdata.org.
Though these principles were written early in the open government data movement, they continue to be relevant. Parts are, however, admittedly U.S.-centric, especially the principle regarding licensing. See section 5.1.3 for a discussion. The principles also neglected to mention cost and that availability meant digitally over the Internet.
Government data shall be considered open if the data are made public in a way that complies with the principles below:
-
Data Must Be Complete
All public data are made available. Data are electronically stored information or recordings, including but not limited to documents, databases, transcripts, and audio/visual recordings. Public data are data that are not subject to valid privacy, security or privilege limitations, as governed by other statutes.
-
Data Must Be Primary
Data are published as collected at the source, with the finest possible level of granularity, not in aggregate or modified forms.
-
Data Must Be Timely
Data are made available as quickly as necessary to preserve the value of the data.
-
Data Must Be Accessible
Data are available to the widest range of users for the widest range of purposes.
-
Data Must Be Machine Processable
Data are reasonably structured to allow automated processing of it.
-
Access Must Be Non-Discriminatory
Data are available to anyone, with no requirement of registration.
-
Data Formats Must Be Non-Proprietary
Data are available in a format over which no entity has exclusive control.
-
Data Must Be License-free
Data are not subject to any copyright, patent, trademark or trade secret regulation. Reasonable privacy, security and privilege restrictions may be allowed as governed by other statutes.
Finally, compliance must be reviewable.
-
A contact person must be designated to respond to people trying to use the data.
-
A contact person must be designated to respond to complaints about violations of the principles.
-
An administrative or judicial court must have the jurisdiction to review whether the agency has applied these principles appropriately.
2. OKF’s Open Knowledge Definition
The Open Knowledge Foundation created the Open Knowledge Definition (OKD), also called the Open Definition, in 2006. It draws heavily on definitions of open source software. Version 1.1, completed in November 2009, is excerpted below and can be found at opendefinition.org.
That the OKD is not specific to government-held data. It is intended to address a broader notion of openness and addresses many concerns that arose for open source software that other collections of principles did not think to include. However, I noted in section 5.1.3 that I believed this definition is too weak to be applied to government data, as it would allow governments to control use of the data through licensing. In countries besides the United States licensing is more common and accepted.
A work is open if its manner of distribution satisfies the following conditions:
-
Access. The work shall be available as a whole and at no more than a reasonable reproduction cost, preferably downloading via the Internet without charge. The work must also be available in a convenient and modifiable form.
-
Redistribution. The license shall not restrict any party from selling or giving away the work either on its own or as part of a package made from works from many different sources. The license shall not require a royalty or other fee for such sale or distribution.
-
Reuse. The license must allow for modifications and derivative works and must allow them to be distributed under the terms of the original work.
-
Absence of Technological Restriction. The work must be provided in such a form that there are no technological obstacles to the performance of the above activities. This can be achieved by the provision of the work in an open data format, i.e. one whose specification is publicly and freely available and which places no restrictions monetary or otherwise upon its use.
-
Attribution. The license may require as a condition for redistribution and re-use the attribution of the contributors and creators to the work. If this condition is imposed it must not be onerous. For example if attribution is required a list of those requiring attribution should accompany the work.
-
Integrity. The license may require as a condition for the work being distributed in modified form that the resulting work carry a different name or version number from the original work.
-
No Discrimination Against Persons or Groups. The license must not discriminate against any person or group of persons.
-
No Discrimination Against Fields of Endeavor. The license must not restrict anyone from making use of the work in a specific field of endeavor. For example, it may not restrict the work from being used in a business, or from being used for genetic research.
-
Distribution of License. The rights attached to the work must apply to all to whom the program is redistributed without the need for execution of an additional license by those parties.
-
License Must Not Be Specific to a Package. The rights attached to the work must not depend on the work being part of a particular package. If the work is extracted from that package and used or distributed within the terms of the work’s license, all parties to whom the work is redistributed should have the same rights as those that are granted in conjunction with the original package.
-
License Must Not Restrict the Distribution of Other Works. The license must not place restrictions on other works that are distributed along with the licensed work. For example, the license must not insist that all other works distributed on the same medium are open.
3. Vancouver Open Data Motion
The Vancouver City Council agreed to a motion on May 21, 2009212 supporting the use of open data, open standards, and open source software. It is excerpted below, focusing on the parts related to open data:
Open Data, Open Standards and Open Source
. . .
WHEREAS the total value of public data is maximized when provided for free or where necessary only a minimal cost of distribution;
WHEREAS when data is shared freely, citizens are enabled to use and repurpose it to help create a more economically vibrant and environmentally sustainable city;
WHEREAS Vancouver needs to look for opportunities for creating economic activity and partnership with the creative tech sector;
WHEREAS the adoption of open standards improves transparency, access to city information by citizens and businesses and improved coordination and efficiencies across municipal boundaries and with federal and provincial partners;
. . .
WHEREAS digital innovation can enhance citizen communications, support the brand of the city as creative and innovative, improve service delivery, support citizens to self-organize and solve their own problems, and create a stronger sense of civic engagement, community, and pride;
WHEREAS the City of Vancouver has incredible resources of data and information, and has recently been recognized as the Best City Archive of the World.
. . .
A. THEREFORE BE IT RESOLVED THAT the City of Vancouver endorses the principles of:
• Open and Accessible Data - the City of Vancouver will freely share with citizens, businesses and other jurisdictions the greatest amount of data possible while respecting privacy and security concerns;
• Open Standards - the City of Vancouver will move as quickly as possible to adopt prevailing open standards for data, documents, maps, and other formats of media;
. . .
B. BE IT FURTHER RESOLVED THAT in pursuit of open data the City of Vancouver will:
1. Identify immediate opportunities to distribute more of its data;
2. Index, publish and syndicate its data to the internet using prevailing open standards, interfaces and formats;
. . .
5. Ensure that data supplied to the City by third parties (developers,contractors, consultants) are unlicensed, in a prevailing open standard format, and not copyrighted except if otherwise prevented by legal considerations;
4. San Francisco Open Data Policy
The San Francisco municipal administrative code on Open Data Policy, adopted November 8, 2010, was the first to adopt language from the 8 Principles of Open Government Data and possibly the first open data law in the United States. It called for technical requirements to be created for the purpose of “making data available to the greatest number of users and for the greatest number of applications,” with “non-proprietary technical standards,” and a “generic license” such as a Creative Commons license.213 Here is the part that requires open data:
2. a. Each City department, board, commission, and agency (“Department”) shall make reasonable efforts to make available data sets under the Department’s control, provided however, that such disclosure be consistent with the rules and standards promulgated by the Committee on Information Technology (“COIT”) and with applicable law, including laws related to privacy.
b. Data sets shall be made available on the Internet through a web portal linked to sfgov.org or successor website maintained by or on behalf of the City.
5. New Zealand Data and Information Management Principles
The New Zealand Data and Information Management Principles, dated August 8, 2011, sets broad goals for how government data should be published.214 It is excerpted here.
The document sets strict standards for when data can be charged for. The paragraph headed Reusable draws on the 8 Principles. It addresses rarer concerns such as authority and long-term preservation.
Open. Data and information held by government should be open for public access unless grounds for refusal or limitations exist under the Official Information Act or other government policy. In such cases they should be protected.
Protected. Personal, confidential and classified data and information are protected.
Readily Available. Open data and information are released proactively and without discrimination. They are discoverable and accessible and released online.
Trusted and Authoritative. Data and information support the purposes for which they were collected and are accurate, relevant, timely, consistent and without bias in that context. Where possible there is an identified authoritative single source.
Well Managed. ... long-term preservation and access ... collaborating with other agencies and the public, facilitating access, strengthening awareness, and supporting international cooperation.
Reasonably Priced. Use and re-use of government held data and information is expected to be free. Charging for access is discouraged. Pricing to cover the costs of dissemination is only appropriate where it can be clearly demonstrated that this pricing will not act as a barrier to the use or re-use of the data. If a charge is applied for access to data, it should be transparent, consistent, reasonable and the same cost to all requestors.
Reusable. Data and information released can be discovered, shared, used and re-used over time and through technology change. Copyright works are licensed for re-use and open access to and re-use of non-copyright materials is enabled, in accordance with the New Zealand Government Open Access and Licensing framework. Data and information are released: at source, with the highest possible level of granularity, in re-usable, machine-readable format, with appropriate metadata; and in aggregate or modified forms if they cannot be released in their original state. Data and information released in proprietary formats are also released in open, non-proprietary formats. Digital rights technologies are not imposed on materials made available for re-use.
A separate document, the New Zealand Government Open Access and Licensing framework, approved in August 2010, sets standards for data licensing. It recommends a Creative Commons license, one that requires the data user to attribute the data back to the government.215
6. AusGOAL Qualities of Open Data
The Australian Governments Open Access and Licensing Framework (AusGOAL) makes recommendations to promote the re-use of government data. AusGOAL’s Qualities of Open Data is excerpted below. The omitted parts contain AusGOAL’s rationale.216
This document has some forward-thinking recommendations, including the use of RDF, SPARQL, and URIs for identifiers, which are technologies for the semantic web. The semantic web has gained little traction for open data either in government or outside, except at Data.gov.uk where RDF is a core part of the platform. It also addresses bulk data, discovery, and the often overlooked issue of text encoding.
1. Open Encoding: Data must be published in an open text format, using UTF-8 as the text encoding, and XML as the structuring framework. Community benefits: You decrease the cost of adapting consumer applications between jurisdictions
2. Open Discovery: Data sets must be published with an associated description (i.e. metadata) in AGLS or equivalent format. . . .
3. Open Linking: A copy of the data should be published under an RDF standard. Community benefits: . . . You allow consumers the option to extend your authoritative data records with detail they have captured (e.g. your Address record gets extended with community details of business signage, photography, etc) . . . You allow machine automation of these abilities
4. Open Query: An copy of the data should be queryable by an open SPARQL endpoint. Community benefits: You increase the efficiency of data set filtering (e.g. find schools in a single suburb) . . .
5. Open Bulk Supply: A copy of the data should be published as a machine readable open bulk supply. . . .
6. Open Identification: Data copies should be identified by a URI and accessible by HTTP or HTTPS. This URI should be stable for the valid lifetime of the data. Community benefits: You remove the need for consumers to re-discover your data each time they attempt access . . .
7. Open Presentation: An corresponding copy of the data should be made available as a human readable web application. Community benefits: You bring the data within reach of entry-level web users
8. Open Always: . . .
9. Open Now: Data should be released to the public at the same time it is released for internal consumption. . . .
7. New Hampshire HB 418
New Hampshire bill HB 418 (2011 session), written by technologist-turned-representative Seth Cohn, requires state software acquisitions to consider open source software, requires new data standards created by the state to be open standards, and directs the commissioner of information technology to develop state-wide information policies based on the 8 Principles. The bill was signed into law in March 2012.217
The bill’s open standards language was copied into Oklahoma bill HB 2197 which was enacted in April 2012.218
Other definitions of open data can be found in California SB 1002 (2012)219, which is currently pending in the California Senate, and the laws discussed at the end of Chapter 4.
While the New Hampshire bill is excerpted below, I have included a significant portion of it because it is interesting to see how data policy can be translated into legal language.
AN ACT relative to the use of open source software and open data formats by state agencies and relative to the adoption of a statewide information policy regarding open government data standards. . . .
This bill requires state agencies to consider open source software when acquiring software and promotes the use of open data formats by state agencies. This bill also directs the commissioner of information technology to develop a statewide information policy based on principles of open government data. . . .
II. “Open standards” means specifications for the encoding and transfer of computer data that: (a) Is free for all to implement and use in perpetuity, with no royalty or fee; (b) Has no restrictions on the use of data stored in the format; (c) Has no restrictions on the creation of software that stores, transmits, receives, or accesses data codified in such way; (d) Has a specification available for all to read, in a human-readable format, written in commonly accepted technical language; (e) Is documented, so that anyone can write software that can read and interpret the complete semantics of any data file stored in the data format; (f) If it allows extensions, ensures that all extensions of the data format used by the state are themselves documented and have the other characteristics of an open data format; (g) Allows any file written in that format to be identified as adhering or not adhering to the format; and (h) If it includes any use of encryption or other means of data obfuscation, provides that the encryption or obfuscation algorithms are usable in a royalty-free, nondiscriminatory manner in perpetuity, and are documented so that anyone in possession of the appropriate encryption key or keys or other data necessary to recover the original data is able to write software to access the data.
. . .
I. The commissioner shall assist state agencies in the purchase or creation of data processing devices or systems that comply with open standards for the accessing, storing, or transferring of data. The commissioner shall: (a) Ensure that any new data standards which the state of New Hampshire defines and to which it owns all rights are open standards compliant. (b) Use open standards unless specific project requirements preclude use of an open data format. (c) Reexamine existing data stored in a restricted format to which the state of New Hampshire does not own the rights every 4 years to determine if the format has become open and, if not, whether an appropriate open standard exists. (d) Make readily accessible, on the state website, documentation on open data formats used by the state of New Hampshire. When data in open format is made available through the state’s website, a link shall be provided to the corresponding data format documentation.
21-R:14 Statewide Information Policy on Open Government Data Standards.
I. The commissioner shall develop a statewide information policy based on the following principles of open government data. According to these principles, open data is data that is:
[the 8 Principles are included here]
. . . Each agency that adopts the policy shall designate a contact person responsible for oversight and implementation of open government data standards for that agency. The contact shall act as a liaison between the department, the implementing agency, and the public in matters related to open government data standards.
8. Model Open Government Executive Directive
The Open Government Initiative is a collaborative project to draft model language for municipal governments interested in open government or open data. Their Model Open Government Executive Directive, published in January 2011220, addresses data publishing and other aspects of open government.
The [City] is committed to creating an unprecedented level of openness in government. City officials will work together and with the public to ensure open and effective government as well as public trust and establish a system of transparency, public participation, collaboration, and accountability.
This memorandum requires [City] departments and agencies to take the following steps to achieve the goal of creating a more open government:
Publish Government Information Online
To increase accountability, promote informed public participation, and create economic development opportunities, each [City Department] shall expand access to information by making it available online in open formats that facilitate access to and reuse of information.
. . .
Presumption of Openness: With respect to information, the presumption shall be in favor of openness and publication (to the extent permitted by law and subject to valid privacy, confidentiality, security, or other restrictions). Where practicable, [City Departments] shall publish all data that is not subject to valid privacy, security, or privilege limitations.
Online and Open: [City Departments] should publish information online and, when practicable, in an open format that can be retrieved, downloaded, indexed, sorted, searched, and reused by commonly used Web search applications and commonly used software.
. . .
Response to Public Feedback: Each [City Department] shall respond to public feedback received through the Open Government Web page on a regular, timely basis. Responses shall include descriptions of actions taken or reasons for not taking action based on public input.
. . .
Licenses: The city shall not assert any copyright, patent, trademark, or other restriction on government information. However, such restrictions may be applied to information shared by the city that was compiled or modified by non-governmental entities or individuals.
Create and Institutionalize a Culture of Open Government
. . .
Open Government Plans: Within 120 days, each the [City] shall develop and publish an Open Government Plan that will describe how the each department will enhance and develop transparency, public participation, and collaboration.
. . .
Working Group: Within 45 days, the [Mayor] and [City Auditor] shall establish a working group that focuses on transparency, accountability, public participation, and collaboration within the [City] government.
. . .
Identification of Barriers, Guidance, and Revisions: Within 120 days, the [City Attorney], in consultation with the [City’s] [Chief Information Officer], will review existing [City] policies to identify impediments to open government and to the use of new technologies and, where necessary, issue clarifying guidance and/or propose revisions to such policies, to promote greater openness in government.
8. CHANGELOG
In software, a Changelog is a list of changes from version to version of a program. This appendix lists changes in the revised editions of the book. s/ . . . / . . . / notation indicates a replacement of text from the first to the second.
1.1 — June 2012
-
Chapter 1, revised to reflect that Clay Johnson was not Sunlight Foundation’s first labs director. That was Greg Elin, in 2006. In footnote 1, added how Jimmy Fallon and Jay Leno cited a Sunlight Foundation study. In the web version, the link to the Sunlight Foundation website had a typo.
-
Also in that chapter, removed “farmers’ market locations” as one of HHS’s datasets — it was from the USDA. Added FDA recalls instead. Removed the footnote to http://health.data.gov as it no longer exists and added a note that I worked on its replacement, http://www.healthdata.gov.
-
Chapter 3, s/three/four/ in the introduction. Section 3.1, s/riled on/citicized/.
-
Chapter 4, noted that NH HB 418 was signed into law, added references to OK HB 2197 and CA SB 1002, and added more on NYC’s Int 0029-2010. Made my outlook more positive in light of the three new state/local laws enacted since I first wrote that section.
-
Section 6.1, added the case of Rep. @DennyRehberg deleting his tweets to appear on Politwoops.
-
Section 7.7, noted that NH HB 418 was signed into law, added references to OK HB 2197 and CA SB 1002.